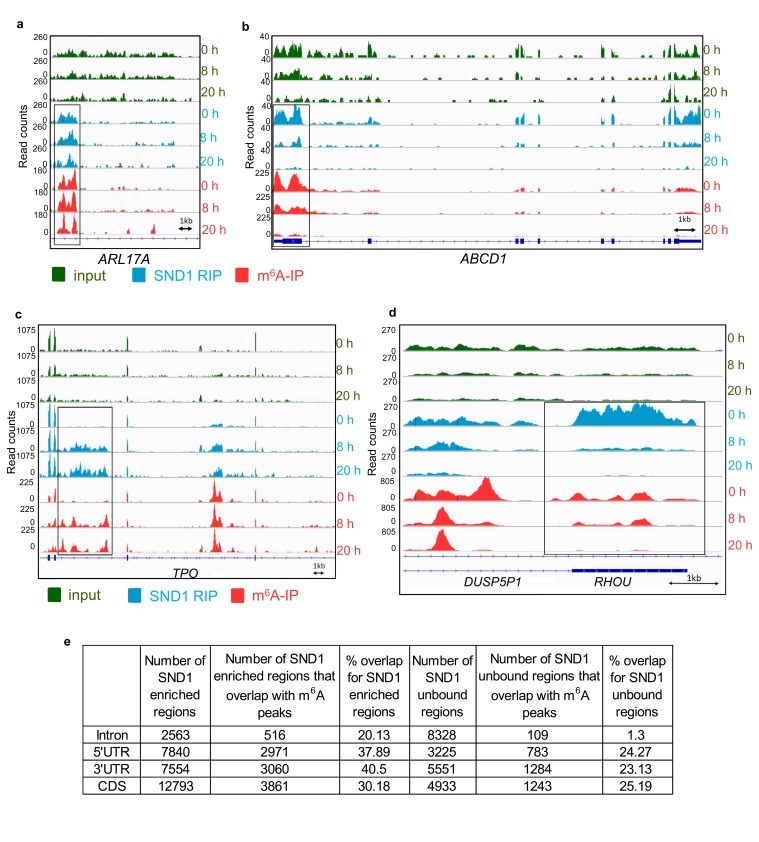
Figure 5. SND1 RNA-binding sites specifically overlap m6A peaks (a, b) Genome sequencing tracks from latent (0 hr) and lytic (8 hr and 20 hr post-reactivation) TREx BCBL1-Rta cells depicting input (green) and RIP (blue) coverage.
m6A-IP reads (red) are also shown. Blue boxes indicate exons while blue lines represent introns. SND1 overlaps with m6A peaks are evident in introns (ARL17A) and 5’UTRs (ABCD1). Note that in ABCD1, SND1 binding and m6A peaks are both reduced at 8 hr post-reactivation while at 20 hr post-reactivation methylation and SND1 binding signal are both lost with decreasing expression in inputs. (c, d) Dynamic SND1 binding to m6A-modified regions in SND1 target transcripts during KSHV infection. Genome tracks depicting sequencing read coverage from input (green) and RIP (blue) samples. m6A-IP reads (pink) are also shown. Note that in contrast to ABCD1, RHOU/DUSP5P1 remain highly expressed even at 20 hr post-reactivation, suggesting the coupled loss of methylation/SND1-binding is independent of the ability to detect these events due to loss of expression. (e) SND1 regions consistently enriched across the three time points studied (0 hr, 8 hr and 20 hr) were defined by applying a fold change RIP/input >2 and>50 mean reads per region (FDR < 1%). Consistently SND1-unbound regions throughout KSHV infection were defined using a fold change RIP/input <0.5 and>50 mean reads per region (FDR < 1%). For all m6A overlap analysis, the cut-off for an m6A peak was defined as having 50 read paired at the tallest point in the m6A peak and a 2-fold enrichment of m6A-IP reads over input reads using a FDR < 1%.

