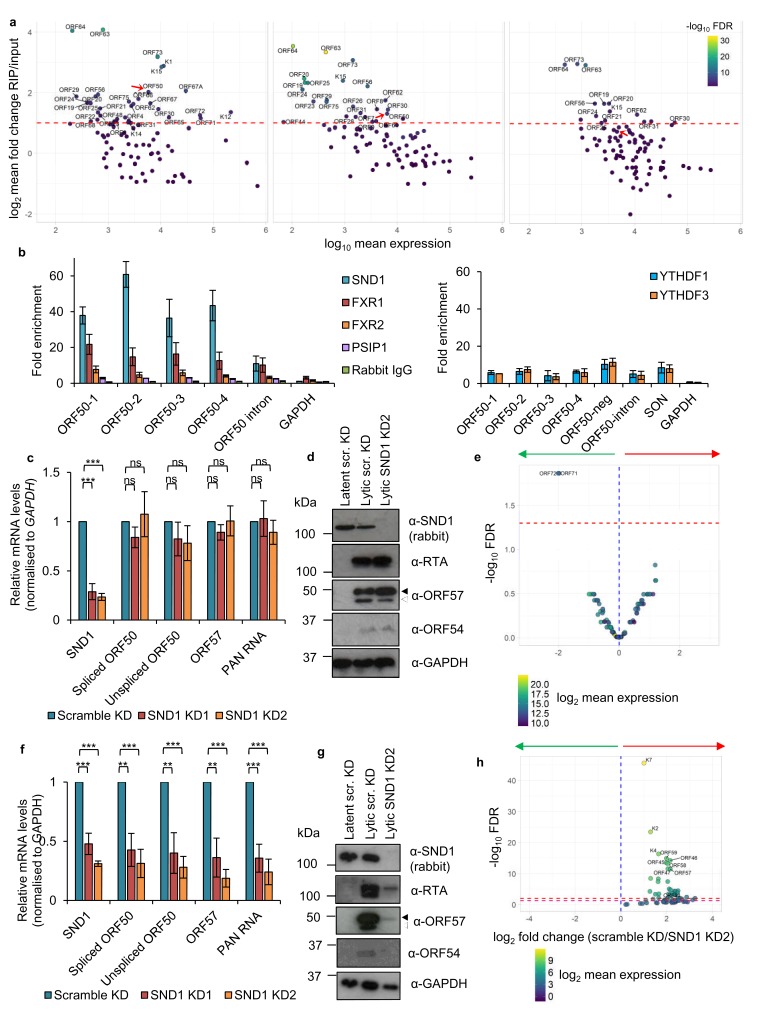
Figure 7. SND1 binds the essential ORF50 RNA in KSHV-infected cells and SND1 knockdown significantly impairs KSHV lytic replication.
(a) RIP-seq identifies KSHV mRNAs as high-confidence SND1 targets at 0 hr (left panel), 8 hr (middle panel) and 20 hr (right panel) post-reactivation. Red dashed line indicates a cut-off of >2 fold change RIP/input. Red arrow points ORF50. Note that lytic genes are also detected in latent cells (0 hr) due to spontaneous KSHV reactivation and the high sensitivity of deep-sequencing. As expected, significantly lower coverage for these lytic genes was detected during latency compared with lytic replication. (b) RIP for endogenous SND1, FXR1, FXR2, PSIP1, normal rabbit IgG, YTHDF1 and YTHDF3 followed by qRT-PCR detection. ORF50-1, ORF50-2, ORF50-3 and ORF50-4 indicate primers that generate an amplicon spanning the first, second, third and fourth m6A peaks of the second exon of ORF50 RNA, respectively. ORF50-intron generates an amplicon spanning the m6A peak in the ORF50 intron. ORF50 negative primers were designed at the start of the second exon of ORF50 RNA. Fold enrichment is relative to the enrichment of the non-target 18S rRNA. Values are averages, error bars present s.d. For SND1 RIPs, n = 4 independent RIPs, for FXR1, FXR2 and normal rabbit IgG n = 3 independent RIPs. For PSIP1 and YTH proteins, n = 2 independent RIPs. (c–h) Stable cell lines expressing scramble shRNA (scr. KD) or two independent shRNAs targeting SND1 were generated using TREx BCBL1-Rta cells (c–e) or BCBL1 cells (f–h). (c) Cellular and viral RNA levels were measured by qRT-PCR 24 hr post-reactivation. n = 3 independent viral reactivations. Values are averages, error bars present s.d. ***p<0.001 using an unpaired t-test. ns = not significant. (d) Immunoblot analysis of protein lysates from latent or 24 hr reactivated cells. ORF57 antibody detects both full length ORF57 protein (black arrow) and the caspase-7-cleaved form (white arrow). For SND1 detection a rabbit polyclonal antibody was used. Western blots are representative of two independent viral reactivations. (e) Volcano plot displaying viral expression of scramble KD and SND1 KD2 cells 24 hr post-reactivation analysed by RNA-seq. The green arrow highlights the quadrant containing upregulated viral ORFs in depleted cells. The red arrow highlights the quadrant containing downregulated ORFs in depleted cells. The red dashed line denotes the FDR < 1% cut-off. (f) Cellular and viral RNA levels were measured by qRT-PCR 24 hr post-reactivation. n = 3 independent viral reactivations. Values are averages, error bars present s.d. **p<0.01, ***p<0.001 using an unpaired t-test. (g) Immunoblot analysis of protein lysates from latent or 24 hr reactivated cells. Western blots are representative of two independent viral reactivations. (h) Volcano plot displaying viral expression of scramble KD and SND1 KD2 cells 24 hr post-reactivation analysed by RNA-seq. The red and purple dashed lines denote the FDR < 1% and FDR < 5% cut-offs, respectively.


