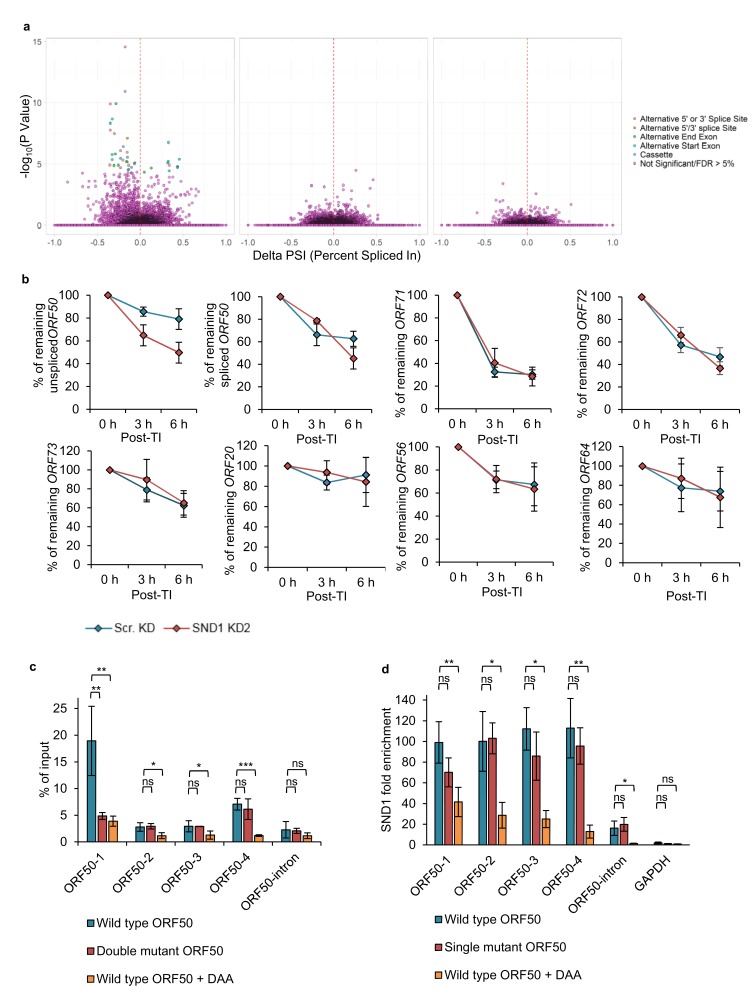
Figure 8. SND1 stabilises native ORF50 RNA and inhibition of m6A deposition on this RNA abolishes SND1 binding.
(a) RNA-seq analysis reveals significant alterations in splicing events between scramble latent and scramble lytic TREx BCBL1-Rta cells (left panel), whilst no significant changes in splicing are observed between scramble and SND1-depleted cells during latency (middle panel) or 24 hr lytic replication (right panel). (b) TREx BCBL1-Rta cells were reactivated for 24 hr into the lytic cycle and transcription was inhibited with the addition of actinomycin D (2.5 μg/ml). Transcripts of interest were measured by qRT-PCR at 0 hr, 3 hr and 6 hr post-transcription inhibition (TI). Each viral gene was normalised against 18S rRNA. Values are averages, error bars present s.d. n = 4 independent viral reactivations. (c) m6A-enrichment was determined by m6A-IP-qPCR. HEK 293 cells were transfected for 24 hr with either wild type (WT) FLAG-ORF50 or a double mutant plasmid in which the GGACT motifs present in the ORF50-1 and ORF50-4 baits were mutated to GGATT. When using DAA, 4 hr after transfection DAA was added at a concentration of 200 µM, and 24 hr post-treatment cells were harvested. % of input was calculated similarly as to ChIP-qPCR analysis. Values are averages, error bars present s.d. *p<0.05, **p<0.01, ***p<0.001 using an unpaired t-test. ns = not significant. For WT ORF50 n = 9 independent m6A-IPs [3 including 0.25% (v/v) DMSO-treatment), for double mutant ORF50 n = 3, for DAA-treated cells n = 3. (d) HEK 293 cells were transfected for 24 hr with either wild type (WT) FLAG-ORF50 or a single mutant plasmid in which the GGACT motif present in the ORF50-1 bait was mutated to GGATT. For DAA-treated cells, 4 hr after transfection DAA was added at a concentration of 200 µM, and 24 hr post-treatment cells were harvested. SND1 enrichment was determined by SND1-RIP-qPCR and is relative to the enrichment found in the non-target 18S rRNA. GAPDH RNA served as an additional non-target RNA. Values are averages, error bars present s.d. For WT and mutant ORF50 n = 4 independent RIPs. For DAA-treated cells n = 3 independent RIPs. *p<0.05, **p<0.01 using an unpaired t-test.


