Figure 2. Player's average switch rates as a function of opponents' switch rates.
Average empirical switch rates for post-win and post-loss trials as a function of the simulated opponents’ switch rates for Experiment 1, 2, 3, and five and the average switch rate of each human opponent in Experiment 4a (tick marks on the x-axis indicate individual average switch rates). The dashed lines for Experiment 1, 2, 3, and 5 show the predictions of the theoretical choice model applied to the group average data (see sections Modeling Choice Behavior and Modeling Results). Error bars represent 95% within-subject confidence intervals. For the analyses, we regressed the player’s switch rate on the opponent’s switch rates, the win-loss contrast, and the interaction between these two predictors after reversing the labels of the opponents’ switch rate predictor for post-loss trials (see section Analytic Strategy for Testing Main Prediction). As a test of these interactions, we show the corresponding t-values (SE): the unstandardized slope coefficients (SE; green = post win, red = post loss) were derived from separate analyses for post-win and post-loss trials.

Figure 2—figure supplement 1. Are feedback effects temporary?

Figure 2—figure supplement 2. Rate of winning as a function of opponent switch rate and n-1 wins/losses.

Figure 2—figure supplement 3. Analysis of action choices.

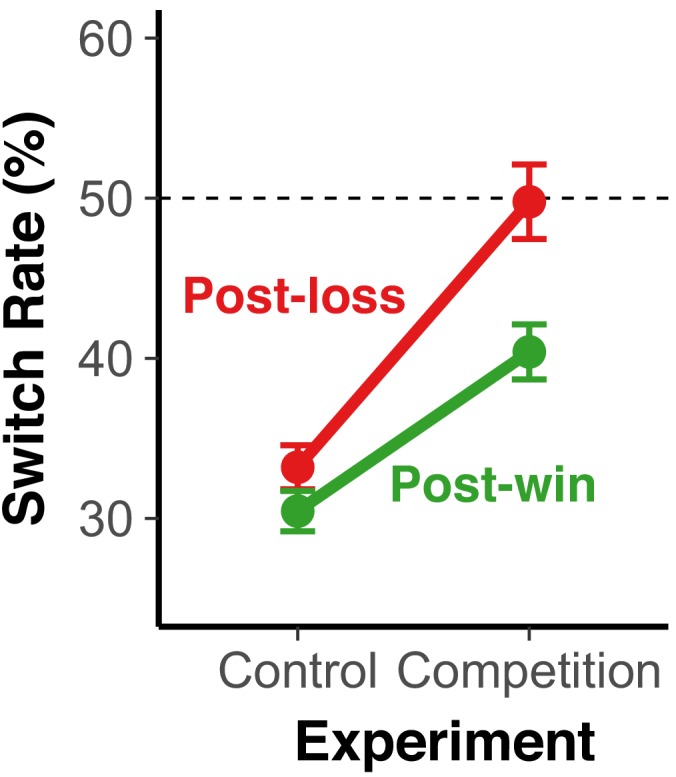
Figure 2—figure supplement 4. Switch rates when competing versus not competing.