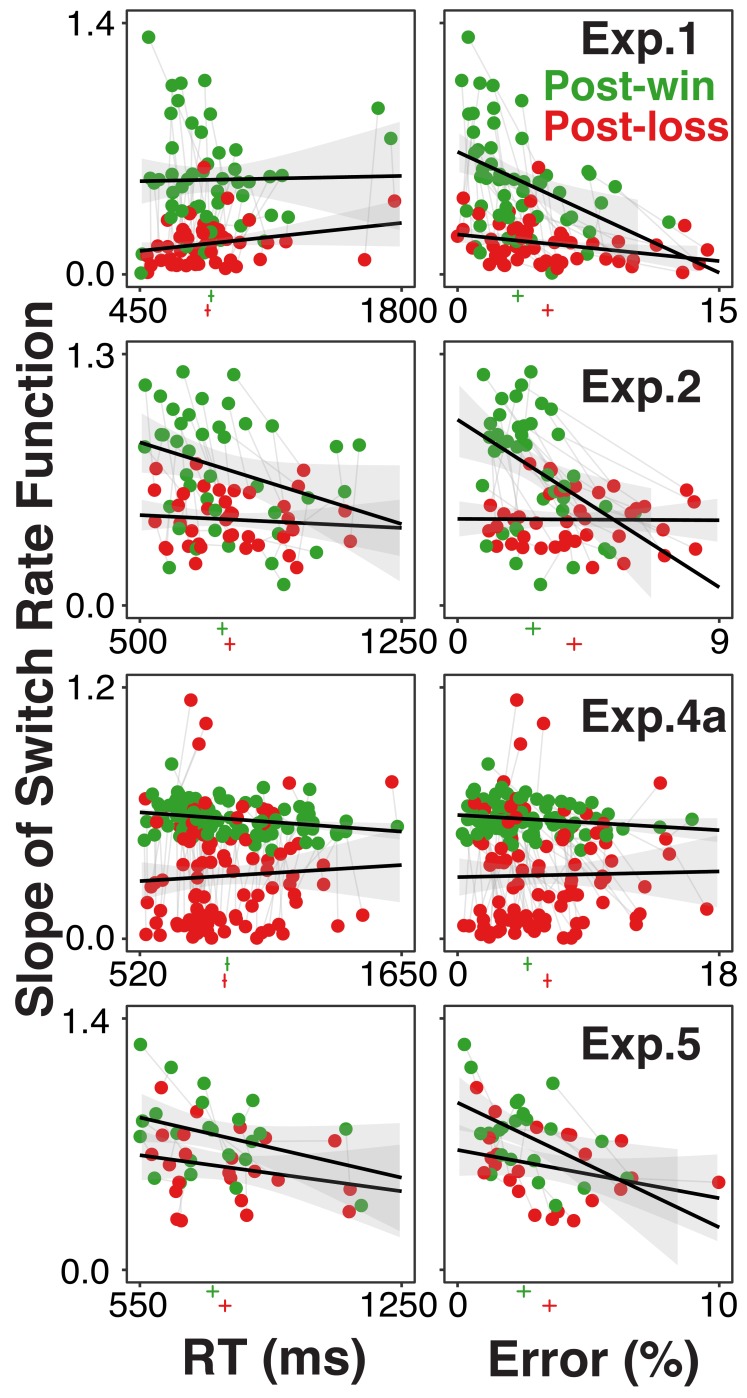
Figure 3. Individual participants’ degree of model-based choice (indicated by slopes of switch rate functions) in relationship to RTs and errors, separately for post-win (green) and post-loss (red) trials, and for each experiment using the rule-selection paradigm.
Each participant is represented both in the post-win and the post-loss condition. The green and red vertical lines below the x-axis of each graph indicate average RTs and error rates, the horizontal lines indicate 95% within-subject confidence intervals. If the increase of choice stochasticity between post-win and post-loss trials were due to greater, general information-processing noise, then the win/loss-related decrease in lopes of the switch rate functions would be accompanied by consistent increases in RTs and/or error rates.

