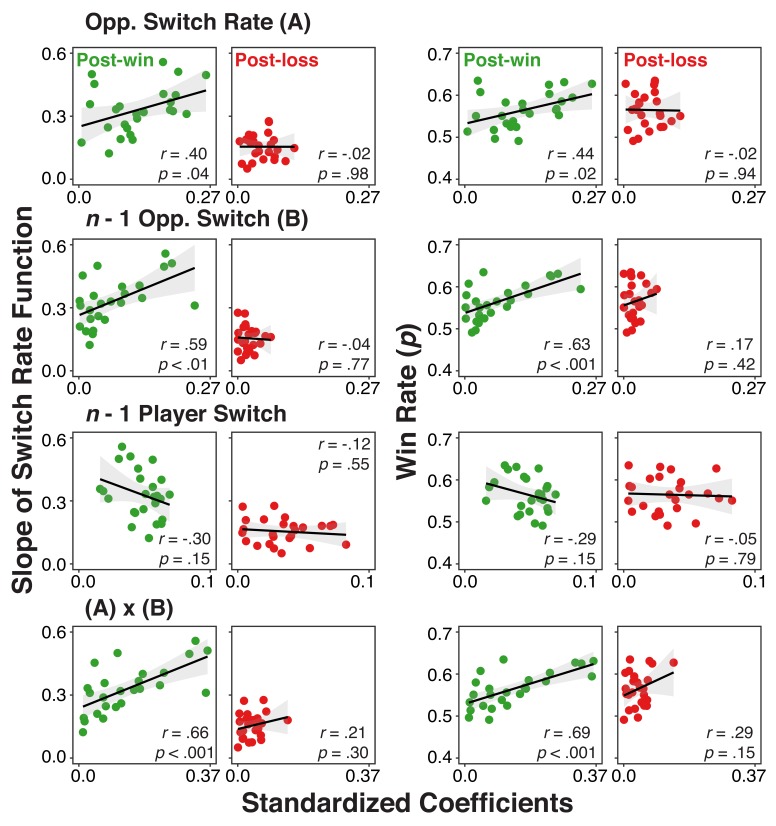
Figure 6. Individual difference correlations between neural-level representation of history/context variables and both use of the model and rate of winning.
Correlations between individuals’ standardized coefficients from the multi-level regression analysis relating the EEG signal to the different history/context variables and 1) their slopes for the switch rate functions (left two columns) or 2) their overall win rate (right two columns) separately for post-win and post-loss conditions. Coefficients were obtained by fitting models with the EEG signals averaged over a 300–700 ms interval of the post-feedback period (the shaded interval in Figure 5).

