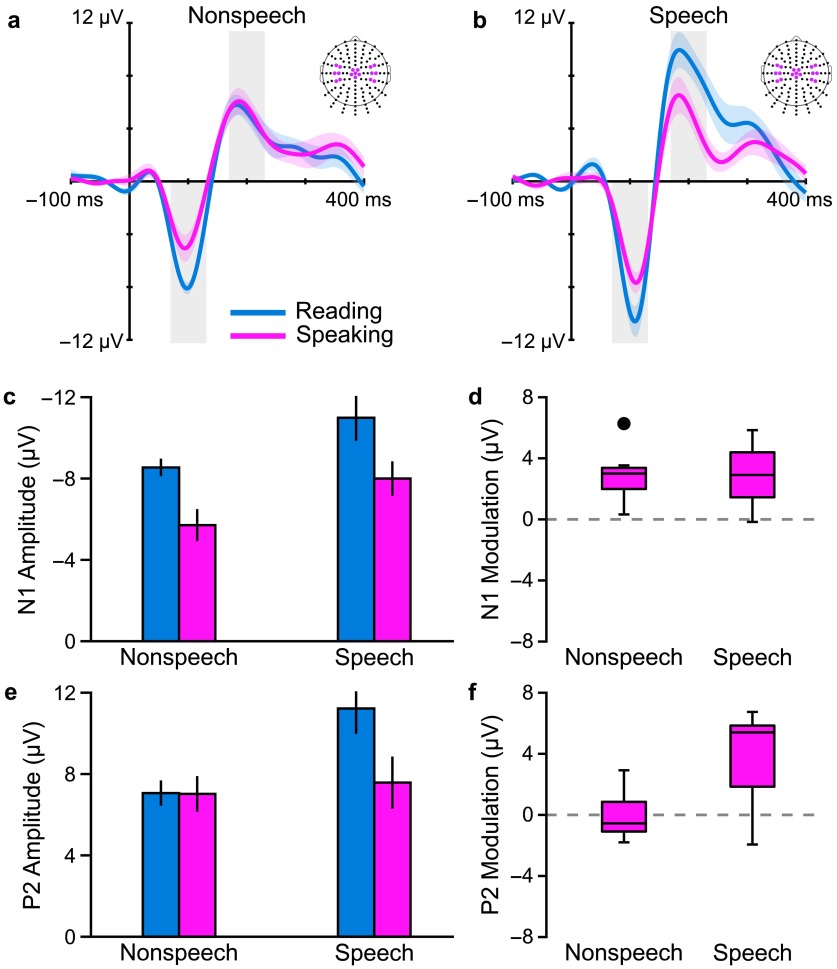
Figure 4.
Nonstuttering speakers' grand-averaged auditory evoked potentials in response to (a) nonspeech stimuli (1-kHz tone) and (b) speech stimuli (/da/ syllable) that were presented either prior to vocalization in a speaking condition (pink) or at the same time point in a silent reading condition (blue). We examined changes in amplitude of the N1 and P2 components (highlighted by the gray-shaded areas in a and b) in the speaking condition versus the reading condition to determine auditory modulation for each type of stimulus. N1 modulation occurred to a similar extent in responses to speech and nonspeech auditory stimuli; (c) N1 amplitudes in the speaking and reading conditions; error bars indicate standard errors of the mean and (d) Boxplot of auditory modulation calculated as |N1Reading| − |N1Speaking|. P2 modulation occurred only in responses elicited by speech stimuli: (e) P2 amplitudes and (f) P2 modulation. All data averaged across the colored electrodes in three regions of interest. Adapted from Daliri and Max (2016), Creative Commons Attribution License (CC BY), Copyright © 2016 Daliri and Max.

 This work is licensed under a