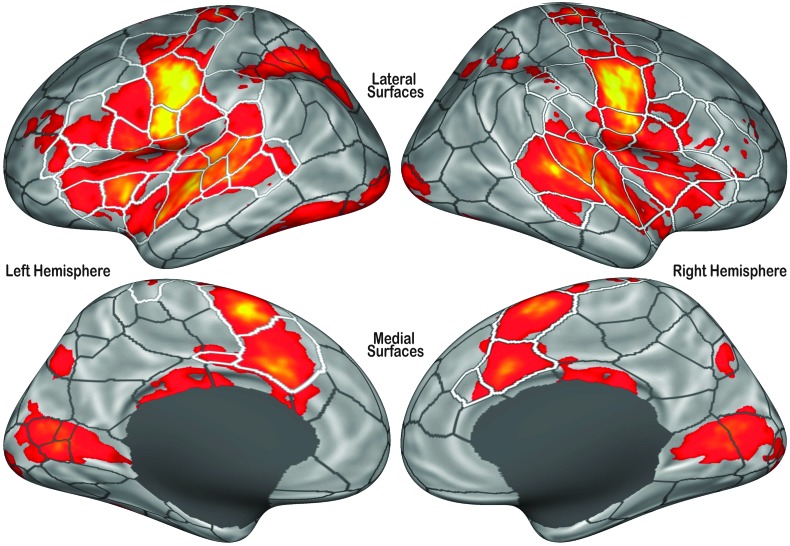
Figure 3.
Completed functional region of interest (fROI) boundaries overlaid upon a t map of cortical vertices that were significantly more active during speech production compared to baseline (vertex-level threshold: p < .001; cluster-level correction: p FDR < .05). The boundaries of fROIs in cortical areas that are reliably active during speech production are highlighted in white.

