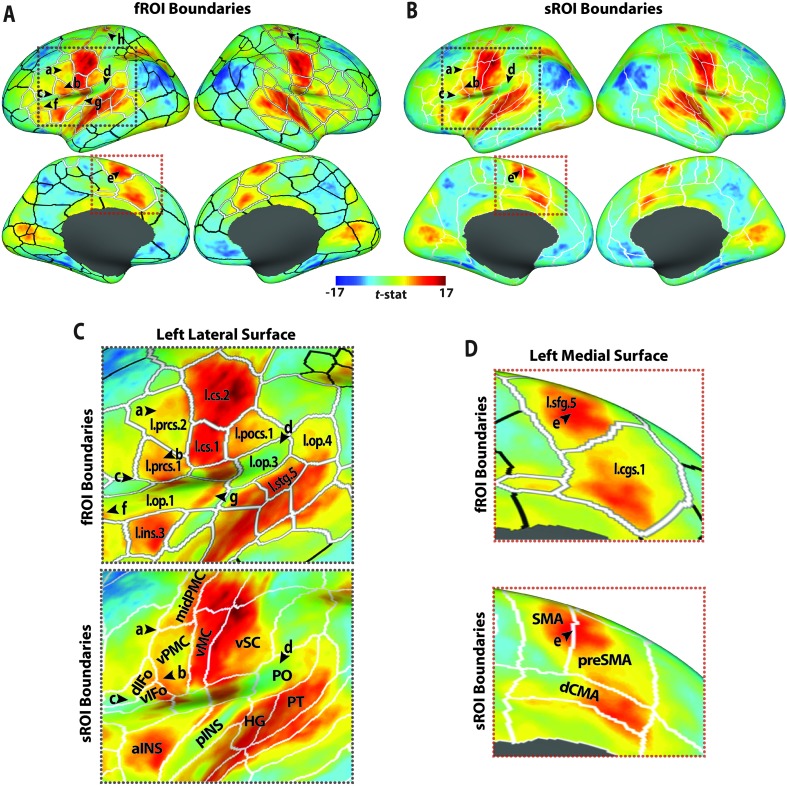
Figure 4.
Functional (A) and structural (B) region of interest (ROI) boundaries are shown overlaying the unthresholded pooled speech–baseline BOLD contrast t map on the inflated cortical surface. Black arrowheads labeled a–e highlight examples of key speech-positive areas where the pooled speech–baseline response is better parceled by the functional boundaries than the structural boundaries. Arrowheads f–i highlight examples of areas where the speech response is not well parceled by the functional ROIs (fROIs). (C) Enlarged illustrations of the portion of left lateral surface indicated by the gray dotted boxes in A (top) and B (bottom). (D) Enlarged illustrations of the portion of the left medial prefrontal cortex indicated by the orange dotted boxes in A (top) and B (bottom). Labels are provided for select functional (top) and structural (bottom) ROIs. fROI abbreviations (all left hemisphere): cgs = cingulate sulcus; cs = central sulcus; ins = insula; op = operculum; pocs = postcentral sulcus; prcs = precentral sulcus; sfg = superior frontal gyrus; stg = superior temporal gyrus. sROI abbreviations: aINS = anterior insula; dCMA = dorsal cingulate motor area; dIFo = dorsal inferior frontal gyrus, pars opercularis; HG = Heschl's gyrus; midPMC = middle premotor cortex; pINS = posterior insula; PO = parietal operculum; preSMA = presupplementary motor area; PT = planum temporale; SMA = supplementary motor area; vIFo = ventral inferior frontal gyrus, pars opercularis; vMC = ventral motor cortex; vPMC = ventral premotor cortex; vSC = ventral somatosensory cortex. fROIs that are consistently active during speech production are highlighted in thick white outlines (cf. Figure 3).

