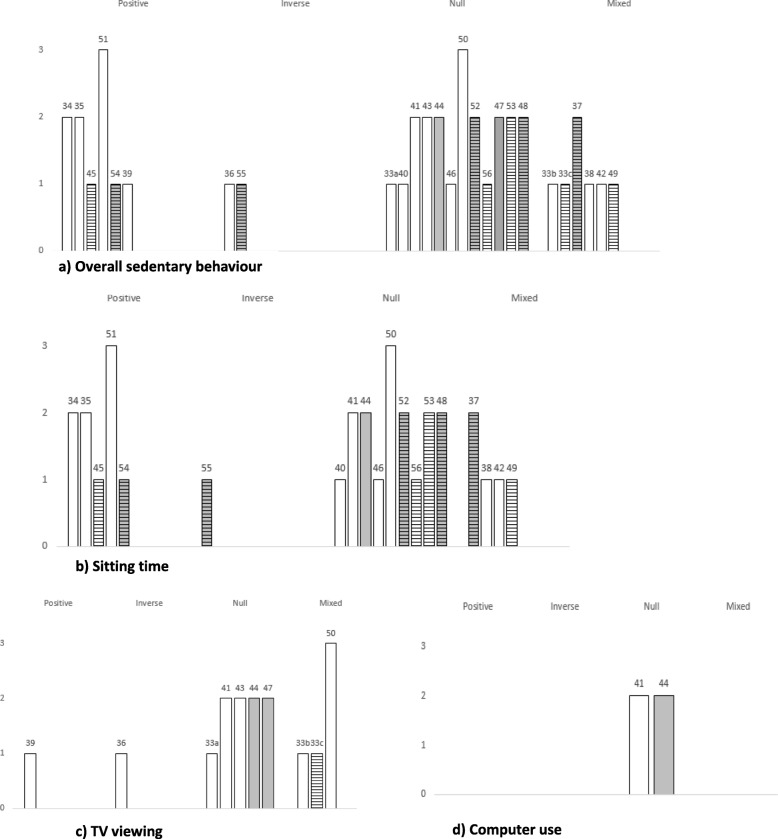
Fig. 2.
Harvest plot: Evidence for association between indicators of sedentary behaviour and stress. Columns represent individual studies with reference numbers above. Column height represents methodological quality of the study (3 = strong, 2 = moderate, 1 = weak). Shading represents objective measure of stress used (not shaded = subjective measure used). Horizontal lines represent objective measure of sedentary behaviour used (no lines = subjective measure used). Note – for studies that included > 1 model, overall association for those studies was calculated on consistency (≥75%) of findings (see also Table 1)

