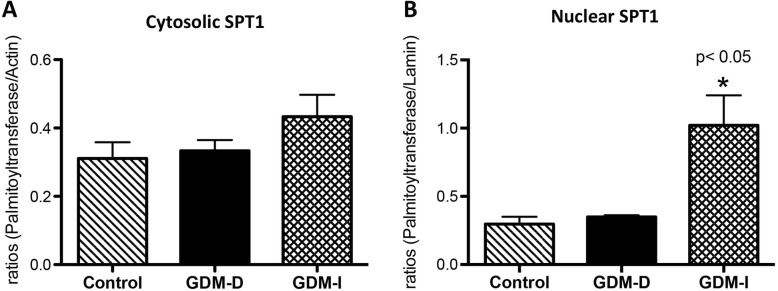
Fig. 2.
Serine palmitoytransferase 1 in control and GDM human placentas. Cytosolic and nuclear levels of serine palmitoytransferase 1 (n = 5) was measured by western blot and quantified by Spot Denso analysis; histograms show mean ± SEM. Cytosolic serine palmitoytransferase 1 levels were not changed in the GDM-D or the GDM-I placentas when compared to control samples (a). Nuclear serine palmitoytransferase 1 levels were elevated in in GDM-I (p < 0.05) placenta when compared to control placenta samples (b). Experiments were conducted in triplicate and statistically different values are noted as * p < 0.05

