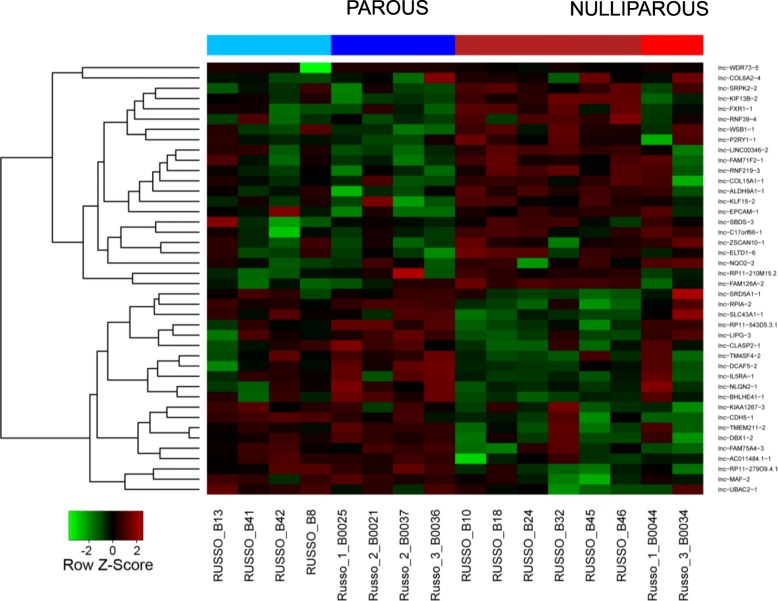
Fig. 1.
Heatmap of differentially expressed lncRNAs in the breast tissue of parous and nulliparous women. From a total of 42 differentially expressed lncRNA regions, 21 were downregulated in parous breast (in green) and 21 were upregulated (in red). Fold change > = 2.0 & adjusted p-value < = 0.05. The two colors under each group (for example, parous = 2 shades of blue) indicate 2 batches sequenced at different times. All other factors were kept them same

