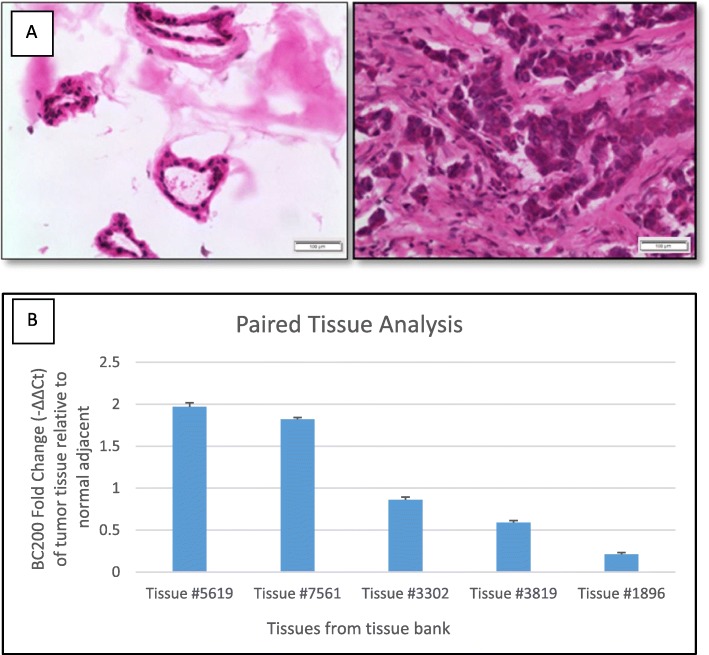
Fig. 3.
Breast cancer tissue quality evaluation and lncEPCAM/BC200 expression in breast cancer tissues. a H&E staining of breast cancer tissues. Expected tissue structures and morphology for normal tissue (left panel - ducts and ductules) and tumor tissue (right panel) (100x magnification). b Expression of BC200 in cancer tissue. BC200 is upregulated in 5 out of 10 patients’ breast tumor compared to normal adjacent tissue (BC200 is not expressed in the other 5 tumor tissues). Fold change was determined by the following equations: ΔCt = Ct_gene – Ct18S; ΔΔCt = ΔCt_gene – ΔCt_GFP; Fold change = 2(−ΔΔCt) where 18S was used as housekeeping gene. Error bars indicate standard deviation between three technical replicates

