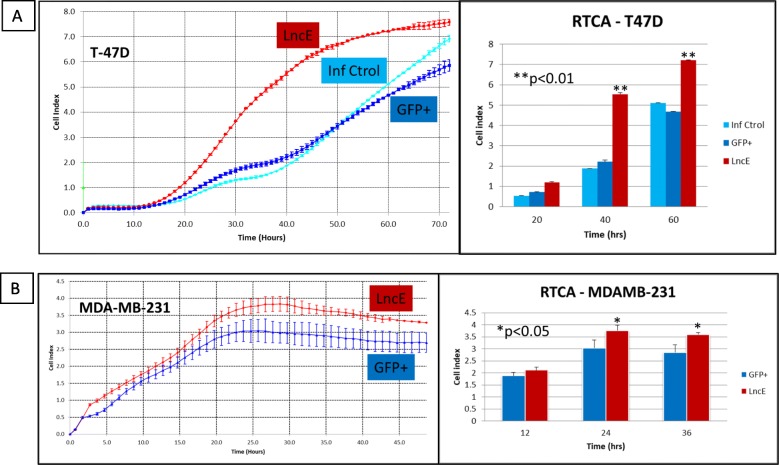
Fig. 5.
Proliferation of T-47D and MDA-MB-231 cells. a Proliferation rate of T-47D by RTCA. Twenty thousand (20,000) cells/well were plated and followed for 72 consecutive hours with data collected every hour; 4 replicates per construct. b Proliferation rate of MDA-MB-231 by RTCA. Fifteen thousand (15,000) cells/well were plated and followed for 48 consecutive hours with data collected every hour; 4 replicates per construct. Cells were recorded for at least 48 h – depending on proliferation rate - to determine proliferation rates of cells overexpressing different constructs (Inf Ctrol: no construct or scrambled; GFP+: GFP-expressing vector/empty vector; LncE: lncEPCAM/BC200 overexpressing cells). Left panel is the graph obtained in real time. Right panel represents results from the left panel at specified time points. Results are representative of 3 independent infections (n = 3). *p.value (p) < 0.05; **p.value (p) < 0.01 (Inf Ctrol for MDA-MB-231 curve overlapped with MDA-GFP+ and was removed from graph for clarity)

