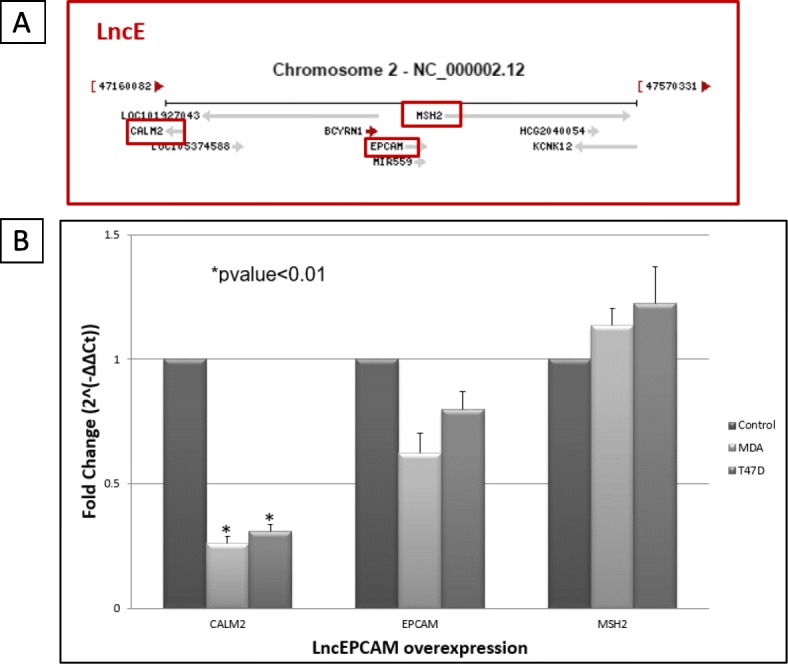
Fig. 7.

LncEPCAM locus. a Genomic region around lncEPCAM. NCBI representation of lncEPCAM/BC200/BCYRN1 genomic neighborhood. CALM2, EPCAM and MSH2 were selected to be further evaluated. b Evaluating Cis regulation. Effect of lncEPCAM/BC200 overexpression on nearby genes in MDA-MB-231 (MDA) and T47D cell lines. Fold change was determined by the following equations: ΔCt = Ct_gene – Ct18S; ΔΔCt = ΔCt_gene – ΔCt_GFP; Fold change = 2(−ΔΔCt) where 18S was used as housekeeping gene and Ct_GFP corresponds to threshold of the gene in cells that express GFP. Error bars indicate standard deviation between two independent experiments. MDA: MDA-MB-231; T-47D: T-47D
