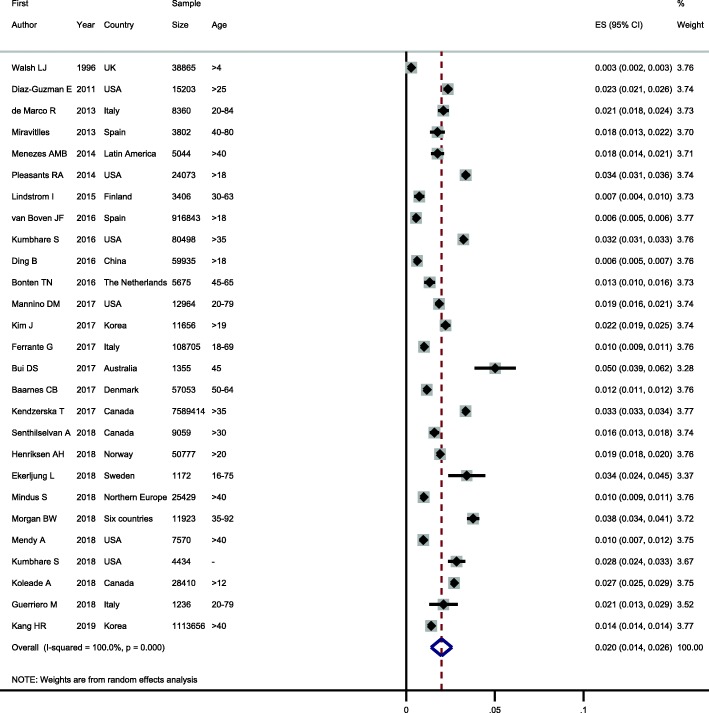
Fig. 2.
Forest plot showing prevalence of ACO in the general population. Note. Squares represent study-specific prevalence estimates (size of the square denotes the study-specific statistical weight); Horizontal lines represent 95% confidence intervals (CIs); Diamond represents summary estimate of Prevalence with corresponding 95% CI.

