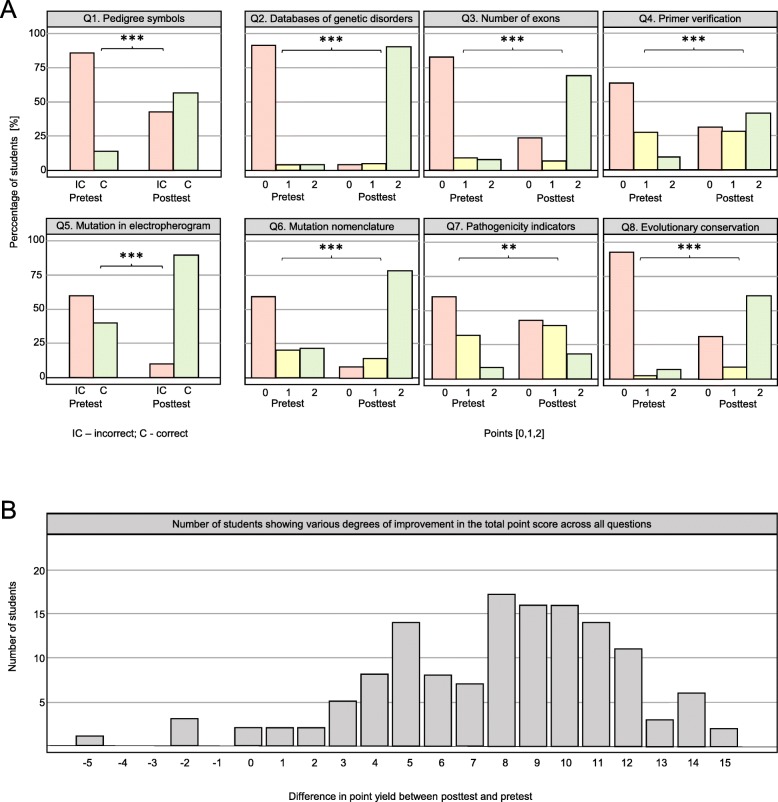
Fig. 3.
Comparison of the pretest and posttest results mapping the impact of the teaching application on students’ knowledge and skills. a Percentages of students obtaining each score (2 points - very good, 1 point - satisfactory, 0 points - unsatisfactory for short-answer questions (Q2-Q4 and Q6-Q8), or “correct” (2 points) and “incorrect” (0 points) evaluation for multiple-choice questions (Q1 and Q5)) in the paired pretests and posttests. *** and ** denote statistical significance at the level of p < 0.001 and p < 0.01, respectively. The results show overall improvement, although it varied between questions. b Number of students showing various degrees of improvement in the total point score across all questions (point yield for the whole test) between pretest and posttest. Numbers on the x-axis indicate differences in point yield between the two tests: negative and positive values indicate worsening and improvement, respectively, theoretically ranging between − 16 and + 16. The results clearly indicate substantial improvement for most students

