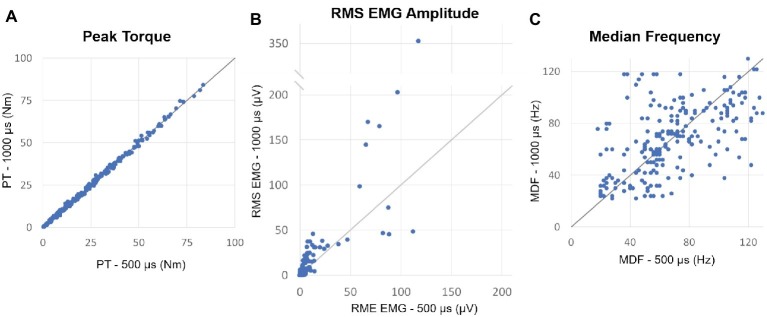
Figure 2.
(A) Plot of the peak torques (PT) from contractions induced by 500 vs. 1,000 μs pulse widths which generated similar muscle torque output and elicited post-NMES EMG activity. The identity line is also shown and indicates that peak torque did not differ between matched contractions induced by the two pulse widths. (B) Plot of the post-NMES EMG RMS value for 500 vs. 1,000 μs pulse widths, as well as the identity line. The majority of the RMS values are above the identity line, indicating that 1,000 μs pulse width resulted in greater post-NMES EMG activity. (C) Plot of the median frequency (MDF) of post-NMES EMG activity for 500 vs. 1,000 μs pulse width, with the identity line. The data appear evenly distributed about the identity line.

