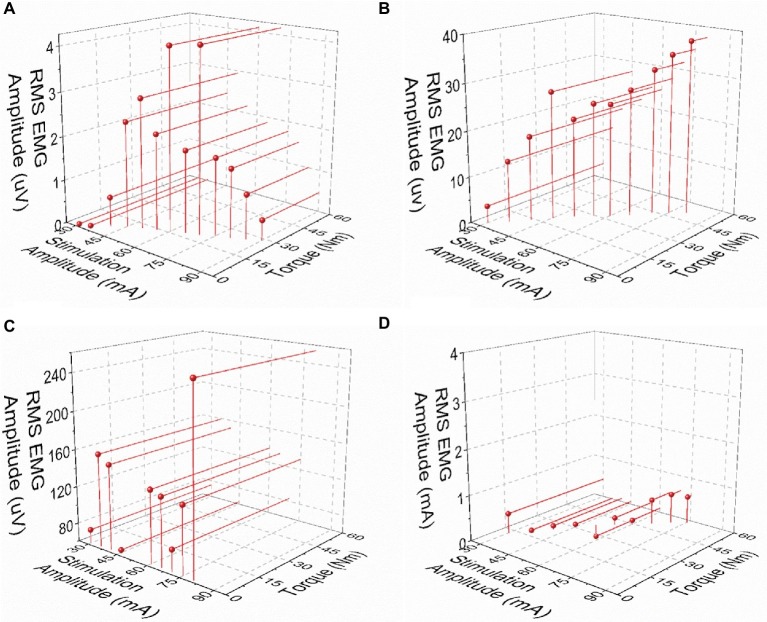
Figure 4.
Exemplary patterns representing the relationships between post-NMES EMG amplitude, torque output, and stimulation amplitude. (A) Increases in stimulation amplitude and torque output, with maximal RMS EMG amplitude value at about mid-stimulation amplitude. (B) Concurrent increments in stimulation amplitude, torque output, and EMG amplitude. (C) Increase in stimulation amplitude with negligible torque output and large EMG amplitude values. (D) Negligible RMS EMG amplitude values with increases in stimulation amplitude and torque output.

