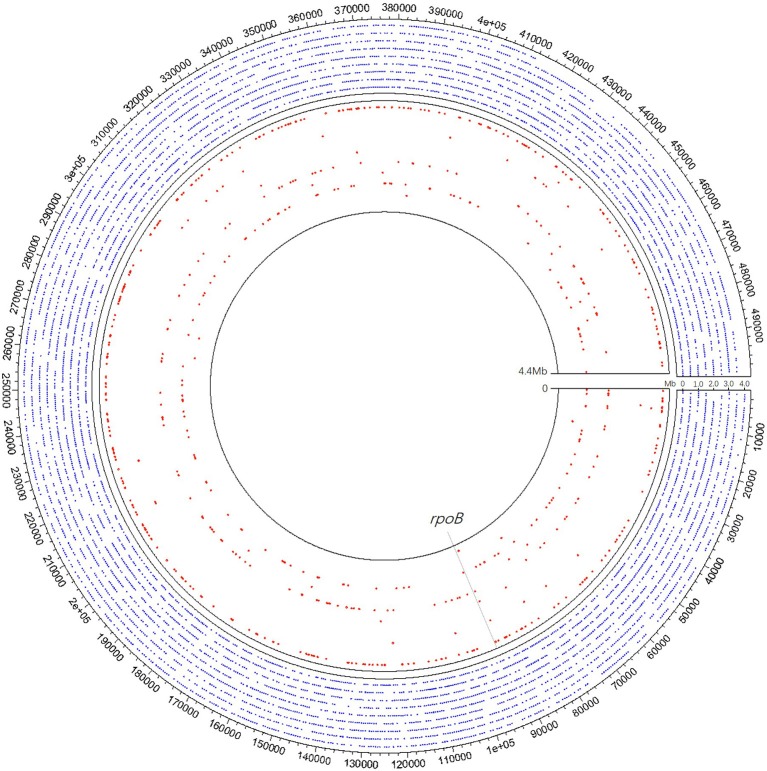
Figure 3.
A schematic diagram of mNGS of 10 samples' genomic coverage across M. tuberculosis reference genome. The result shows that mNGS was able to detect much more region of the genome apart from rpoB. Outer nine circles of the blue dot area all refer to one pus sample of coverage 18.73%, of which each circle represents 0.5 Mb of the genome. Each of the nine red circles of the inner layer represents one sample. The gray dotted line represents the rpoB region.

