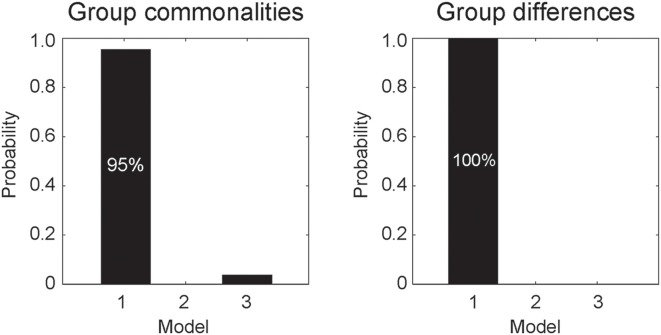
Figure 3.
Posterior probabilities of the models, accounting for group commonalities (left) and differences (right) between the ASD and TD groups determined by dynamic causal modeling (DCM) analysis. Model 1, which incorporates the modulatory effect of dynamic expression from the amygdala to the neocortex, best accounted for both commonalities and differences.

