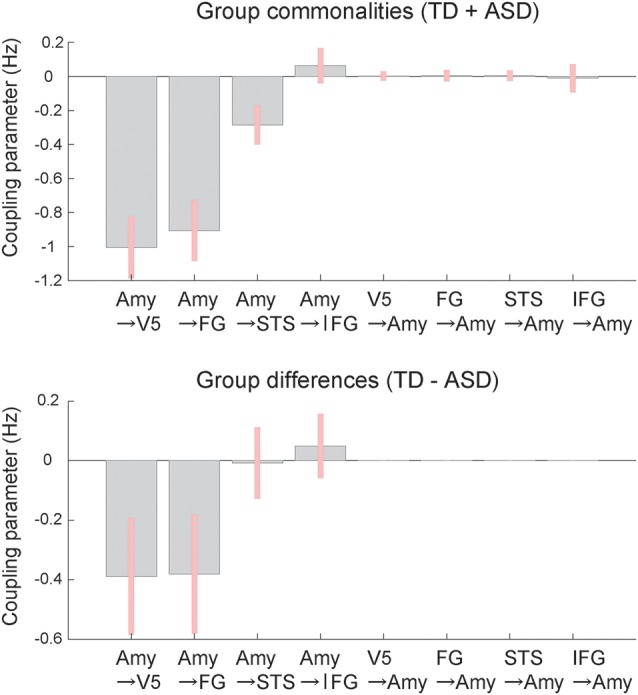
Figure 4.

Mean coupling parameters of the modulatory effect of dynamic expression for group commonalities (upper) and differences (lower) between the ASD and TD groups determined by DCM analysis. Pink bars indicate 90% Bayesian credible intervals. Amy, amygdala; FG, fusiform gyrus; IFG, inferior frontal gyrus; STS, superior temporal sulcus; V5, fifth visual area/middle temporal area.
