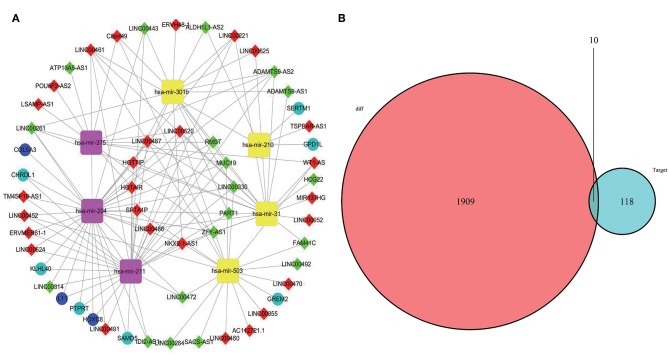
Figure 4.
CeRNA network was visualized in Cytoscape (A). The yellow represents miRNA upregulation and purple downregulation. The red means lncRNA upregulation and green downregulation. The mazarine indicates mRNA upregulation and blue downregulation. Gray edges indicate lncRNA-miRNA-mRNA interactions. (B) Venn diagram of DEmiRNAs might target DEmRNAs.

