Figure 6.
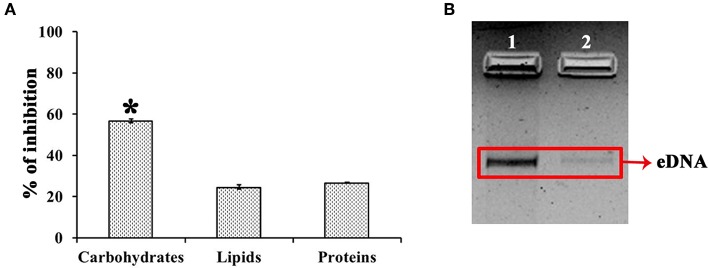
Effect of UMB on biopolymers of biofilm matrix. (A) Bar chart depicting the percentage inhibition of carbohydrates, lipids and proteins of biofilm matrix upon UMB treatment. (B) Agarose gel image indicating the effect of UMB on eDNA content of biofilm matrix. Lane 1—MRSE control; Lane 2—MRSE treated with UMB (at 500 μg/ml). The red box highlights the eDNA band of control and UMB treated samples. *Statistical significance between control and treated samples from three independent experiments (p < 0.005).

