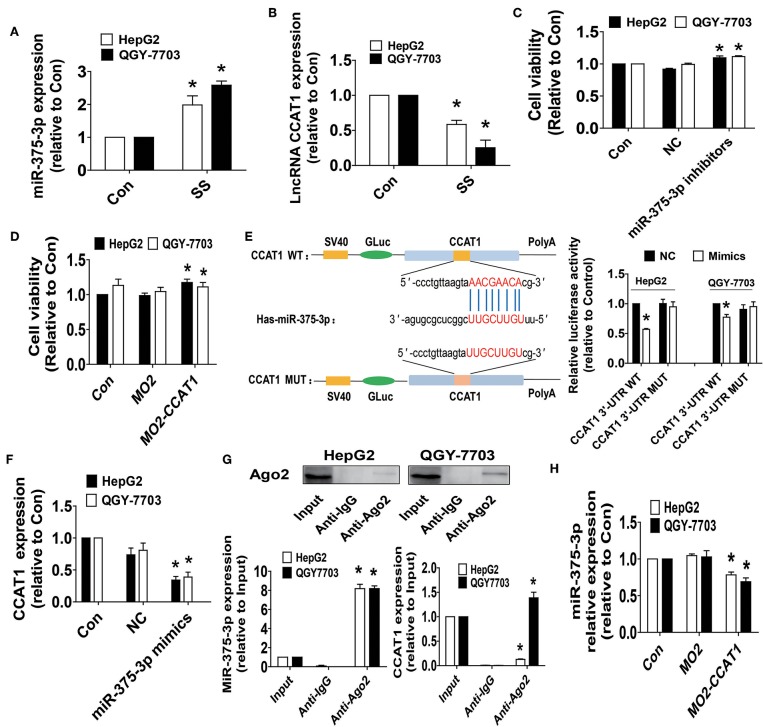
Figure 2.
SS increased the expression of miR-375-3p and inhibited the levels of lncRNA CCAT1, and there was reciprocal interaction of CCAT1 and miR-375-3p in HCC cells. (A,B) HepG2 and QGY7703 cells were treated with SS (45 μM) for 24 h, and the expression levels of miR-375-3p and CCAT1 were measured via qRT-PCR. (C,D) HepG2 and QGY7703 cells were transfected with the control or miR-375-3p mimics (100 nM), CCAT1 expression vectors for up to 48 h followed by determining cell growth via MTT assays. (E) The luciferase reporter constructs containing the wild type and mutant binding sites in 3′-UTR region of CCAT1 were shown (upper panel). HepG2 and QGY7703 cells were transfected with the CCAT1 3'UTR-WT or CCAT1 3′-UTR-Mut vectors (1.25 μg/mL each) for 24 h, then treated with the miR-375-3p mimics (100 nM) or miR-negative control (NC) for an additional 48 h. Afterwards, the luciferase activity was detected using Secrete-Pair™ Dual Luminescence Assay Kit as described in the Materials and Methods section (lower panel). (F) HepG2 and QGY7703 cells were treated with the control or miR-375-3p mimics (100 nM) for up to 48 h followed by determining the expression levels of CCAT1 via qRT-PCR. (G) Cell lysates from HepG2 and QGY7703 cells were incubated with Ago2 antibody-coated magnetic beads. Precipitates ware subjected to Western blot for Ago2 protein and qRT-PCR for detecting CCAT1 and miR-375-3p expression levels. Preimmune IgG and input from cell extracts were used as controls. (H) HepG2 and QGY7703 cells were transfected with the control or CCAT1 overexprssion vectors for up to 48 h followed by determining the expression levels of miR-375-3p via qRT-PCR. Values in bar graphs were given as the mean ± SD from three independent experiments. *Indicates significant difference as compared to the untreated control group (P < 0.05).

