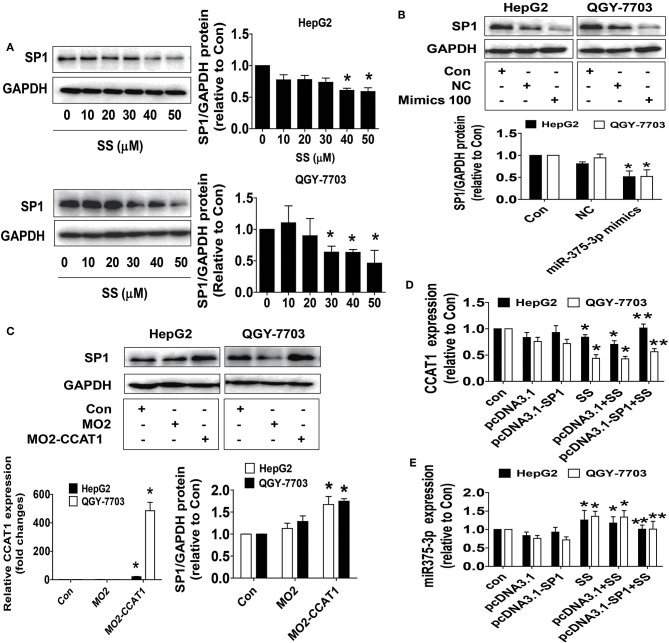
Figure 3.
SS and the mimics of miR-375-3p reduced SP1 protein expression whereas overexpressed CCAT1 enhanced SP1 protein expression. (A) HepG2 and QGY7703 cells were treated with different concentrations of SS for 24 h. The expression of SP1 protein was detected by Western blot. GAPDH was used as a loading control. (B,C) HepG2 and QGY7703 cells were treated with mimics of miR-375-3p or transfected with the control and excessive expressed CCAT1 vector for up to 24 h before exposing the cells to SS (45 μM) for an additional 24 h. Afterwards, the expressions of SP1 proteins were detected by Western blot. GAPDH was used as a loading control. The figures are representative cropped gels/blots that have been run under the same experimental conditions. (D,E) HepG2 and QGY7703 cells were transfected with the control or SP1 expression vectors for 24 h before exposing the cells to SS (45 μM) for an additional 24 h followed by measuring the expression levels of CCAT1 and miR-375-3p via qRT-PCR. Values in bar graphs were given as the mean ± SD from three independent experiments. *Indicates significant difference as compared to the untreated control group (P < 0.05); **Indicates significant difference from SS treated alone (P < 0.05).

