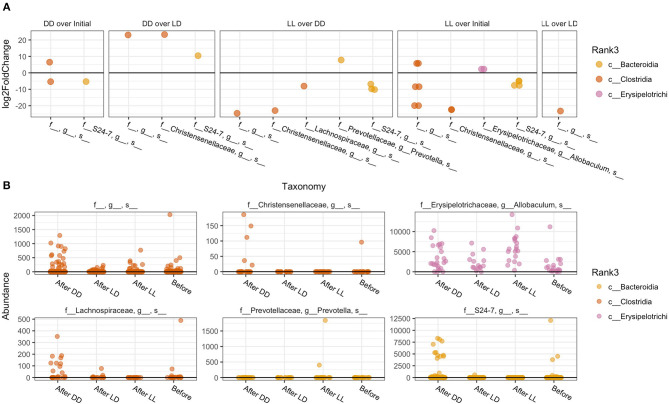
Figure 4.
Specific taxa that significantly differed according to light regimen. (A) Abundance of taxa after exposure to the different light regiments and before treatment. (B) Differential abundance testing with DESeq2 revealed that these OTUs were significantly different between two or more of the treatment groups (adjusted p < 0.001).

