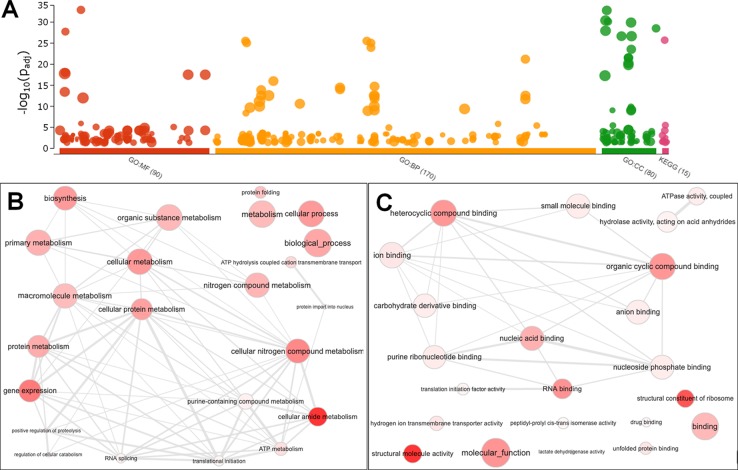
Figure 5.
Gene Ontology Enrichment of down-regulated genes from SmJNK knockdown schistosomula. (A) Manhattan plot illustrating the enrichment analysis results separated into four categories: GO : MF (Molecular Function), GO : BP (Biological Process), GO : CC (Cellular Component), and KEGG Pathways. The number in the source name in the x-axis labels shows how many significantly enriched terms were found. The circle corresponds to term size. The term location on the x-axis is fixed and terms from the same GO subtree are located closer to each other. Interactive graph of the representative subset of the GO terms related to biological process (B) and molecular function (C) enriched in down-regulated genes from SmJNK knockdown schistosomula. Bubble colors indicate the p-value and size indicates the frequency of the GO term in the underlying Gene Ontology Annotation database. Highly similar GO terms are linked by edges, where the line width indicates the degree of similarity.

