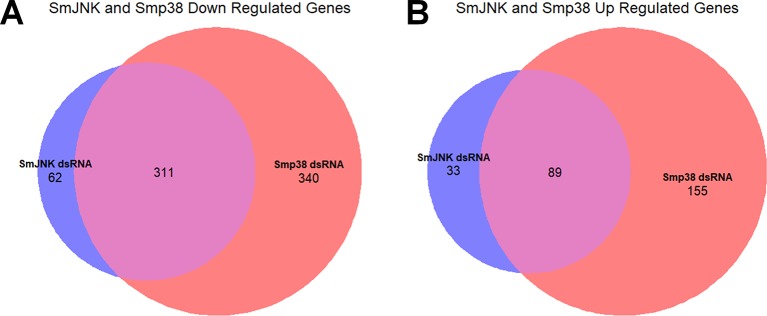
Figure 6.
Overlap of DEGs in schistosomula knocked-down for SmJNK and Smp38 MAPKs. Venn diagram representing the number of genes with a decrease (A) or increase (B) in gene expression after exposure to SmJNK or Smp38 dsRNAs. In red are represented DEGs regulated by Smp38, in blue SmJNK, and in pink are the overlapping DEGs in both datasets.

