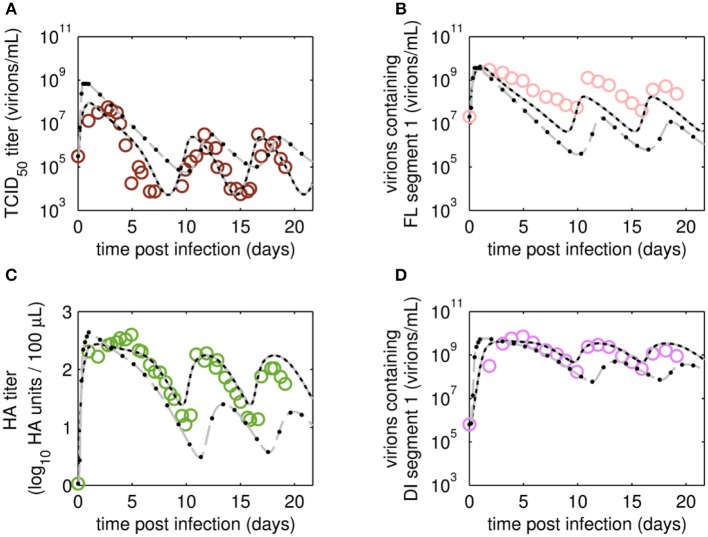
Figure 6.
Dynamics of viral subpopulations, produced by MDCK.SUS2 cells infected by A/PR/8/34-delS1(1) in a parallel continuous bioreactor system at RT 22 h, were fitted using different models. Experimental data (open circles) and four model fits (various lines) are shown for (A) TCID50 titer representing infectious virions of (B) the FL S1-containing virions as well as the sum of all viral subpopulations as log HA units (C) and DI S1-containing virions (D). Every subfigure shows the four model fits, using Model 1 containing all parameters (gray solid line), Model 2 with kdvit = kvdt = 0 (black dotted line), Model 3 with kvi = kvidi (gray dashed line) or Model 4 with kvi = kvidi and kdvit = kvdt = 0 (line of black circles). For the sake of simplicity only every 2nd data point is shown for the qPCR-based data (B,D). For both experiment and model simulations, the continuous culture was started 23.4 h p.i.

