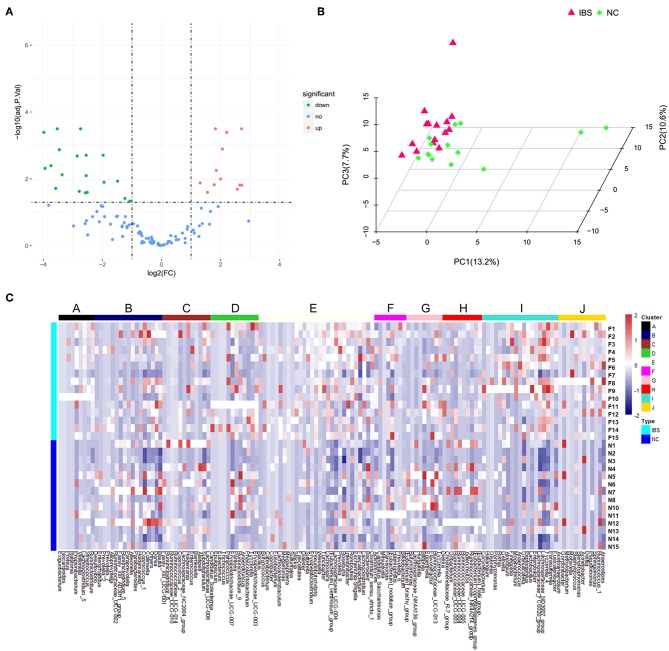
Figure 2.
Microbial profiling analysis in IBS and healthy controls. (A) Volcano Plots showed that there were 19 significantly up-regulated (red dots) and 12 markedly down-regulated (green dots) microbial populations in IBS patients compared to the healthy controls. (B) PCA plots showed the IBS patients couldn't be discriminated from the healthy controls. (C) The heatmap profile showed that all microbes detected were divided into 10 clusters, and no single genus or genus cluster could clearly identify IBS from the healthy controls.

