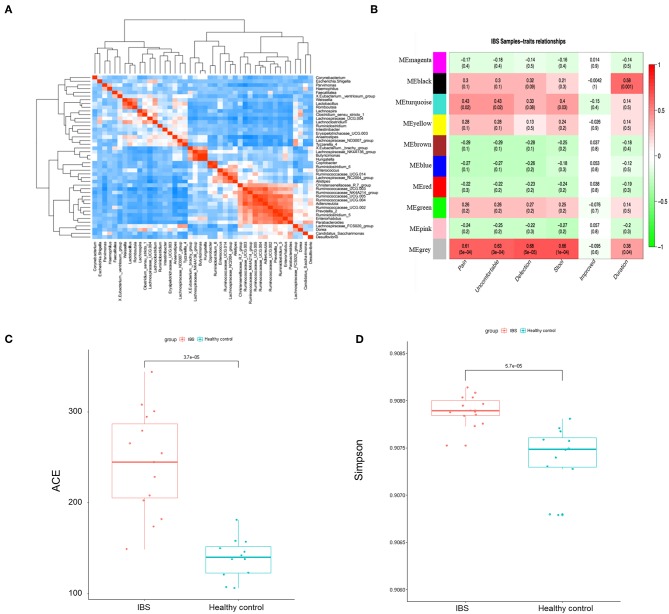
Figure 4.
The association between microbial profile and severity of IBS. (A) The correlation matrix showed that some microbes were positively correlated with each other and some were negatively correlated with each other. (B) Module-trait association of microbes. Each row corresponds to a module of microbes, and column corresponds to a clinical trait. Each cell contains the corresponding correlation and P-value. Each table is colored by correlation according to the color legend on the left. Alpha diversity of ace (C) and simpson (D) index of the IBS patients and the healthy controls.

