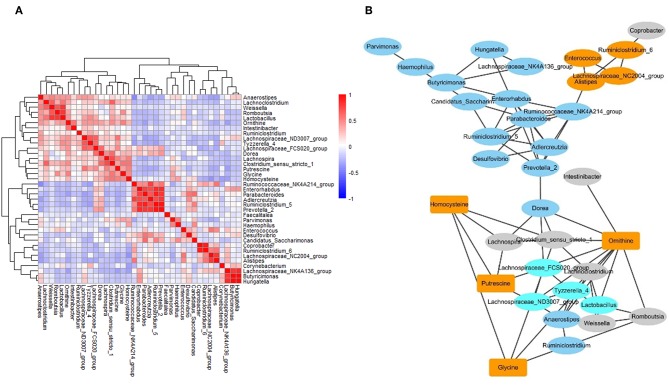
Figure 5.
The networks of gut microbiome and metabolites in IBS patients. (A) The correlation matrices between microbial genus abundances and fecal metabolites. (B) A network generated by Cytoscape. Each node represented a metabolite/microbe. Ellipse node represent microbe, and rectangle node represent metabolite. Different color reflected different cluster by WGCNA. The edge linked the nodes reflected the Pearson correlation coefficient between those nodes. Higher coefficients were displayed with thicker lines.

