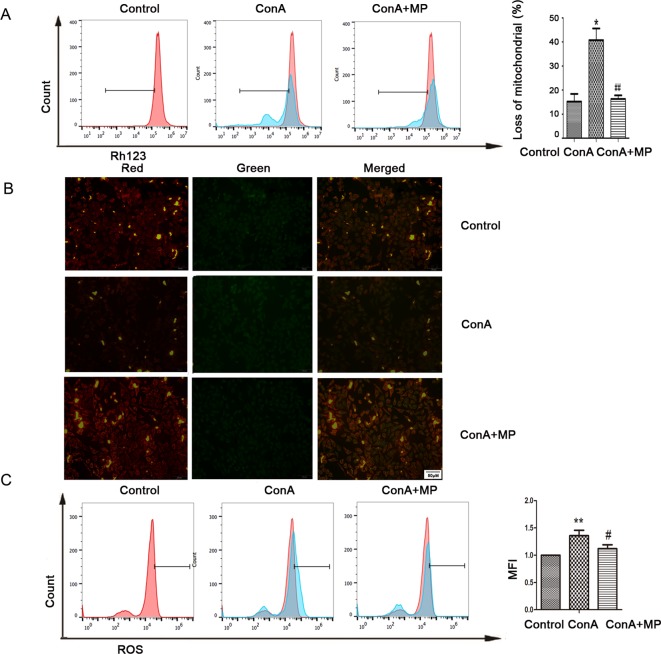
Figure 6.
Variation in the Ψm and ROS level. (A) LO2 cells were treated with ConA with or without MP for 12 h. The red branches represent the control. Data are shown as the mean ± SD, *P < 0.05 vs. control group; # P < 0.05 vs. ConA group; (B) The Δψm (red/green) alteration in LO2 cells was determined by fluorescence microscopy analysis after staining with JC-1. (C) LO2 cells treated with ConA with or without MP for 12 h were incubated with 10 mM DCFH-DA for 30 min, and the ROS level was then analyzed by flow cytometry. The control groups are presented as lines filled with red color; the relative MFI level in the treated group was calculated after setting the control group expression (0 μg/ml) value to 1.00. Data are shown as the mean ± SD, *P < 0.05 vs. control group; **P < 0.01 vs. control group; #P < 0.05 vs. ConA group; ##P < 0.01 vs. ConA group. ConA, concanavalin A; MP, methylprednisolone; Ψm, mitochondrial membrane potential; ROS, reactive oxygen species; MFI, mean fluorescence intensity.

