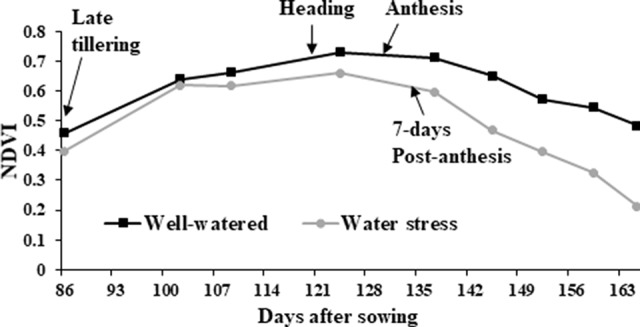
Figure 2.

Normalized difference vegetation index (NDVI) in wheat genotypes. Average of all wheat genotypes grown in the 2014 field experiment under well-watered (black line with squares) and water stress (gray line with circles) treatments. NDVI was calculated from late tillering until late reproductive stage using Crop Circle.
