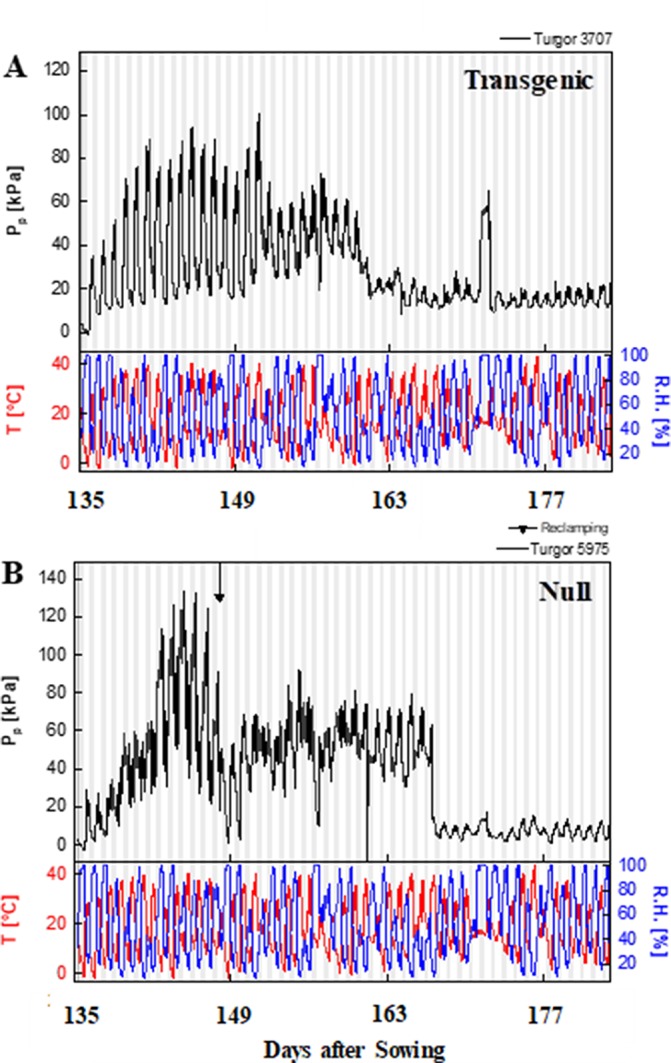
Figure 5.

Patch pressure (PP) of representative event 37 plants during reproductive phase. Patch pressure (kPa) and weather data collected for a representative transgenic (A) and null (B) plants during the 2015 field experiment under water stress treatment. Pp was measured using Leaf Patch Clamp Pressure (LPCP) probes clamped on flag leaves. White and gray vertical bars represent day and night, respectively. T, temperature (°C); RH, relative humidity (%).
