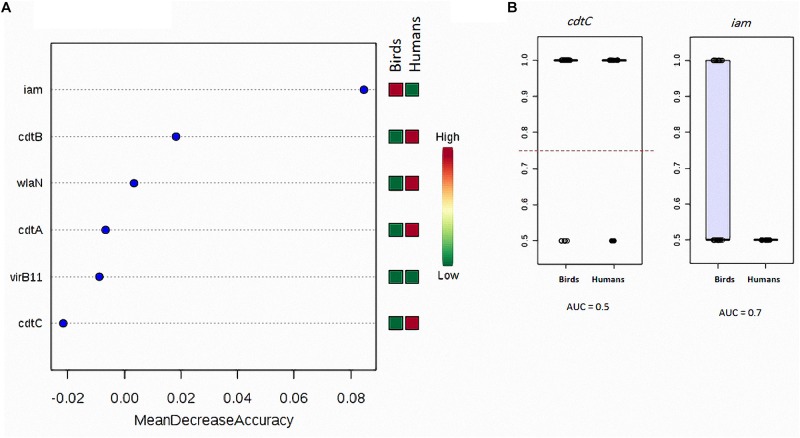
FIGURE 1.
Degree of similarity and discriminatory power of analysed virulence genes in C. jejuni strains among various sources. (A) Random forest classification showing the predictive accuracy of the studied genes (X-axis). The mini heat map shows the frequency distribution of each gene in the respective strain sources. Each dot refers to one gene with the respective mean decrease accuracy. (B) Box-plot showing the differences in the distribution of cdtC and iam genes between birds and human sources of C. jejuni. The horizontal dotted line refers to the optimal cutoff value. The AUC data were generated by running the ROC curves as described in the “Materials and Methods” section.

