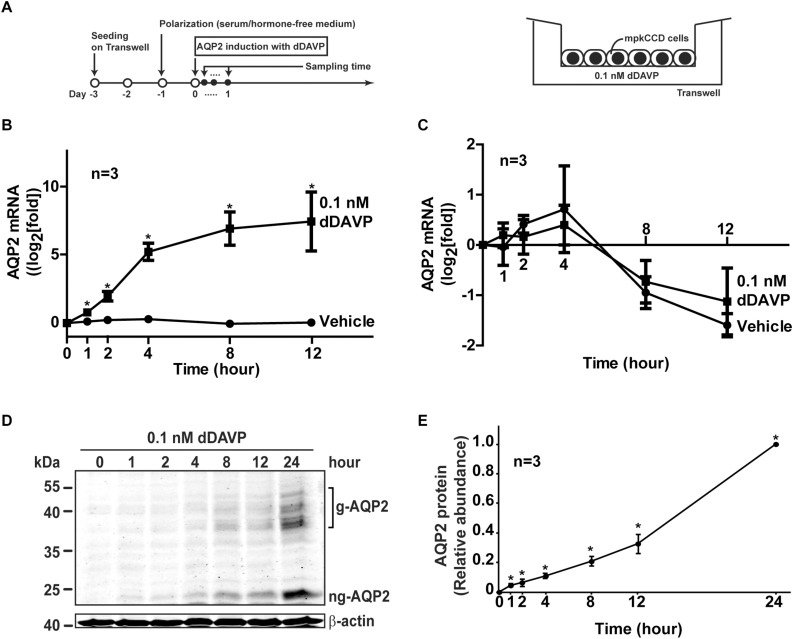
FIGURE 1.
Vasopressin increased AQP2 gene expression in the mpkCCD cells. (A) The experimental protocol for cell polarization and endogenous AQP2 induction. (B) Time-course quantitative real time PCR measurements of AQP2 mRNA in the mpkCCD cells exposed to vehicle or vasopressin analog (0.1 nM dDAVP). Values are means ± SE, adjusted for loading with the RPLP0 mRNA levels and normalized against the values at time zero. Asterisk indicates significance (p < 0.05, t-test) against the values of the vehicle-treated cells at the same time point. (C) Time-course measurements of AQP2 mRNA in the mpkCCD cells in the presence of actinomycin D. Polarized mpkCCD cells were induced to express AQP2 mRNA (24 h). The cells were then treated with actinomycin D (2 μM) in the absence or presence of dDAVP for the indicated time before the AQP2 mRNA measurements. (D,E) Representative and summary of immunoblotting for AQP2 protein in the mpkCCD cells in response to dDAVP. Values are means ± SE, adjusted for loading with β-actin levels and normalized against the values at 24 h. Asterisk indicates significance (p < 0.05, t-test) against the values at 0 h. Two-way ANOVA was used to assess time-dependent effects of dDAVP vs. vehicle treatment. Respectively, g-AQP2 and ng-AQP2 indicate glycosylated and non-glycosylated AQP2.

