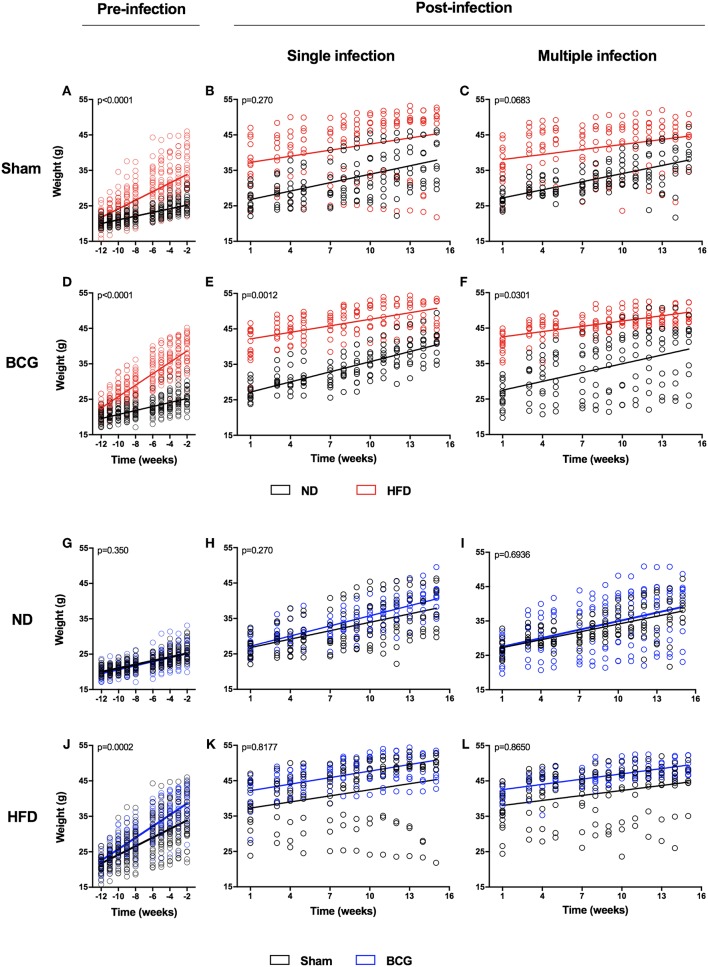
Figure 1.
Weight evolution during the experiment in pre- and post-infection status. Weight evolution of the same experiment is represented by comparing ND and HFD (A–F) and Sham and BCG (G–L). Panels represent: pre-infection and sham (A), SI and sham (B), MCI and sham (C), pre-infection and BCG (D), SI and BCG (E), MCI and BCG (F), pre-infection and ND (G), SI and ND (H), MCI and ND (I), pre-infection and HFD (J), SI and HFD (K), MCI and HFD (L). Linear regression are represented together with p-values. Slopes' values are included in Table S1.

