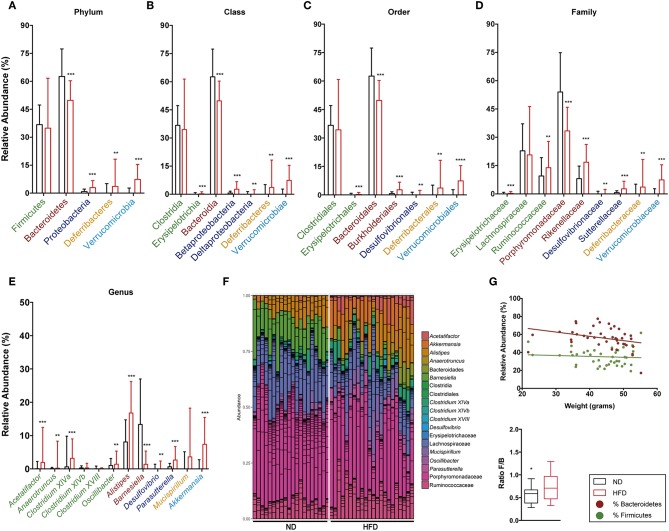
Figure 10.
Taxonomic composition of the intestinal microbiota based on 16S rRNA sequencing at week 28 after starting both diets. Analysis of the relative abundance of the most abundant phylum (A), class (B), order (C), family (D), and genus (E) in ND vs. HFD. (F) Bar plot representation of the OTUs of each sample according the taxonomic classification. (G) Regression plot of Firmicutes and Bacteroidetes phyla against animal weight and analysis of the F/B ratio in ND and HFD. *p < 0.05, **p < 0.01, ***p < 0.001, ****p < 0.0001; Mann–Whitney test.

