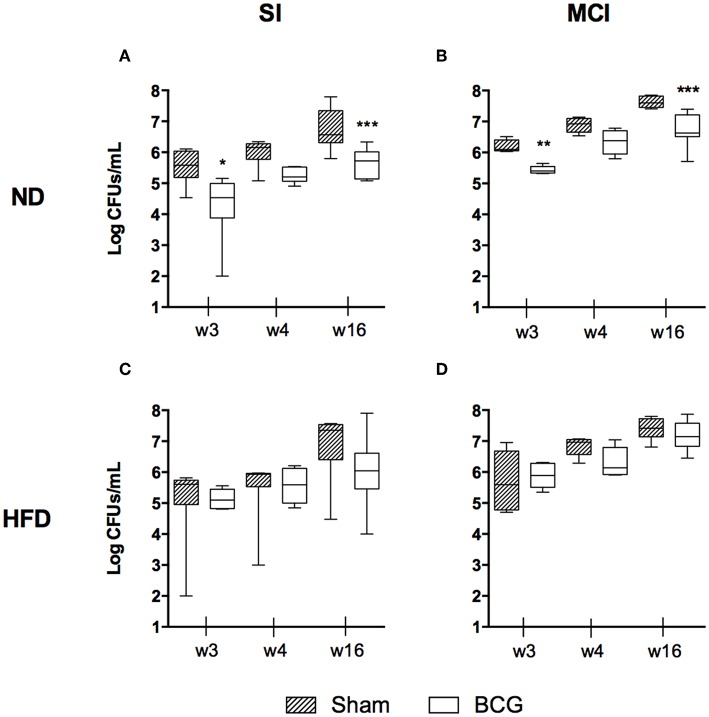
Figure 2.
Bacillary load progression at different end time points (w3, w4, and w16) are shown as log CFUs/ml. Each panel compares sham and BCG vaccinated groups: ND and SI (A), ND and MCI (B), HFD and SI (C), HFD and MCI (D). Box and whiskers plots show the minimum, first quartile, median, third quartile and maximum values. *p < 0.05, **p < 0.01, ***p < 0.001; Mann–Whitney test.

