Figure 4.
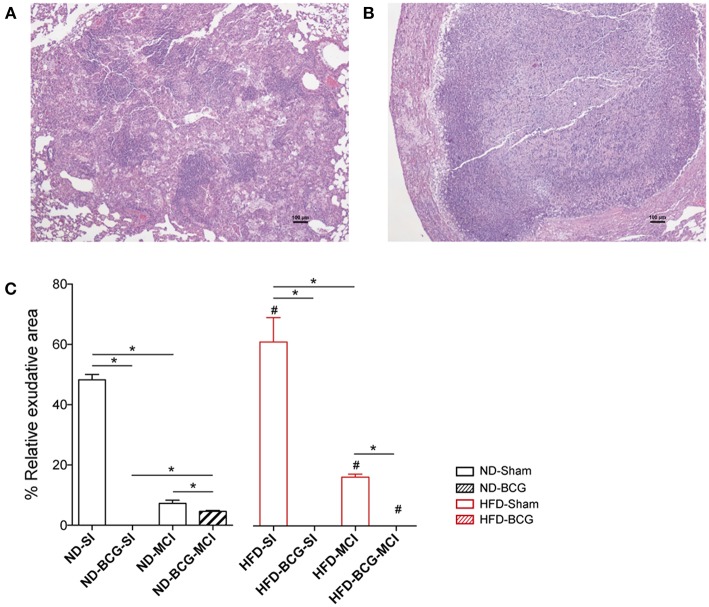
Quality of the lesions found at week 16 post-infection. The tissue sections show a proliferative (A) and an exudative (B) lesion stained with H/E. (C) Relative percentage of exudative lesions at week 16. Black bars represent ND groups while red bars represent HFD groups. Hatched bars in each type of diet represent vaccination Bar plots show median with range. Asterisk indicates differences between vaccination and infection in each diet; hashtag indicates differences between diets. *p < 0.05, #p < 0.05; Mann–Whitney test.

