Figure 7.

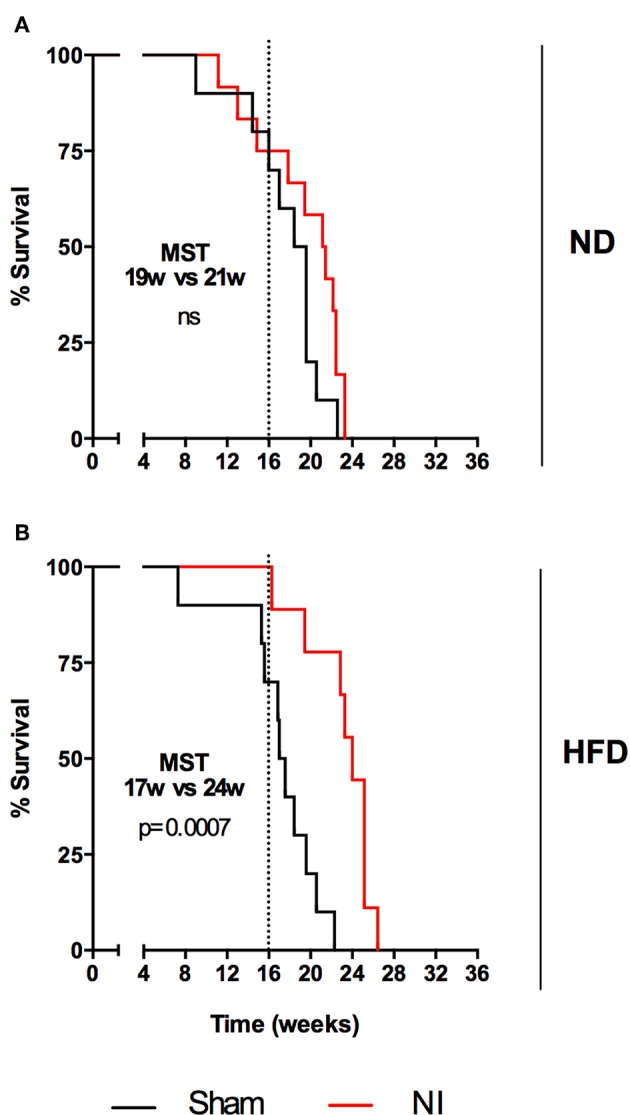
Evolution of survival after Mtb infection for the second experiment. Each panel compares sham and NI groups: ND (A) and HFD (B). Median survival times and p-values are indicated in each panel. Log-rank test.

Evolution of survival after Mtb infection for the second experiment. Each panel compares sham and NI groups: ND (A) and HFD (B). Median survival times and p-values are indicated in each panel. Log-rank test.