Figure 8.
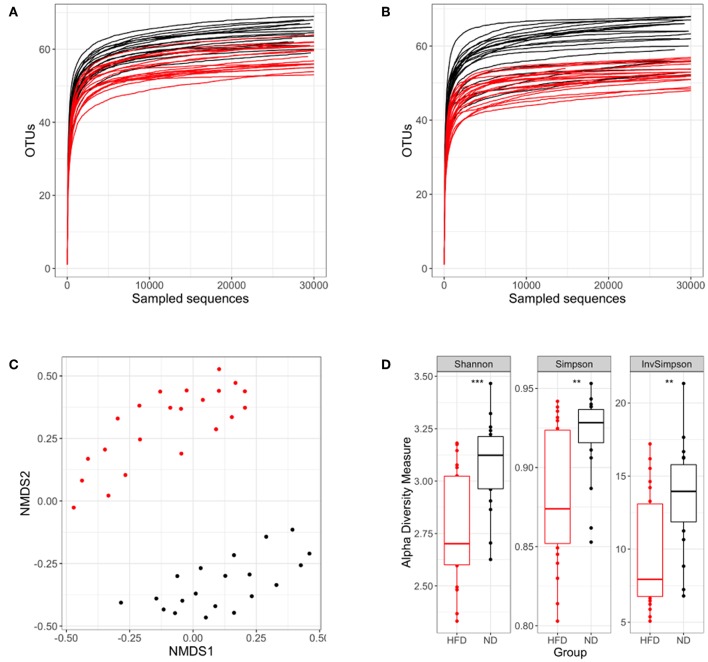
Analysis of the microbiota diversity based on 16S rRNA sequencing. In each panel the ND group is colored in black and the HFD group in red. Rarefaction curves at week 16 (A) and week 28 (B) after starting the different diets are represented. (C) NMDS ordination in samples following different diets. (D) Shannon, Simpson and inverse Simpson diversity indexes. **p < 0.01, ***p < 0.001; Mann–Whitney test.

