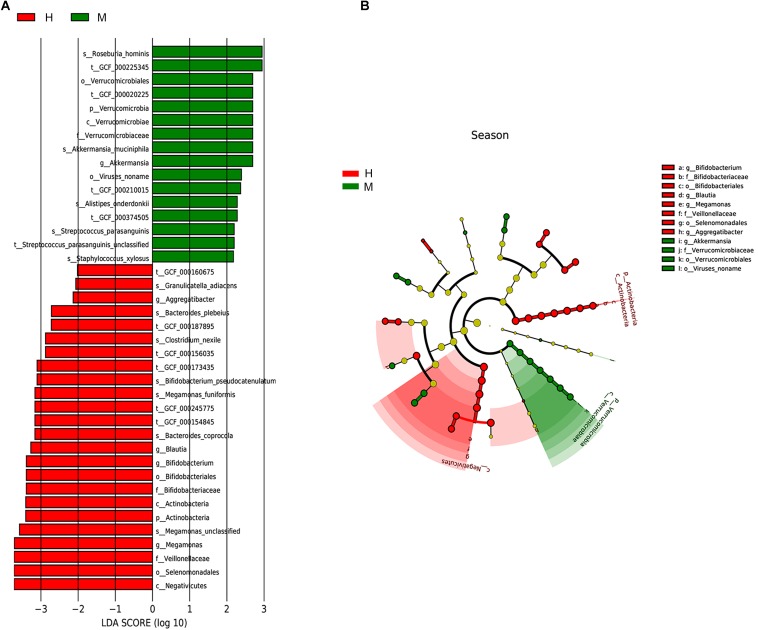
FIGURE 3.
Taxonomic differences of gut microbiota in MSA and healthy groups predicted on different levels. (A) Histogram of the LDA scores computed for taxa differentially abundant between groups. (B) Cladogram indicated the phylogenetic distribution of fecal microbiota associated with MSA and healthy subjects. Each dot represented a taxonomic entity and the taxonomic levels ranged from phylum to species from the inner to outer circles.

