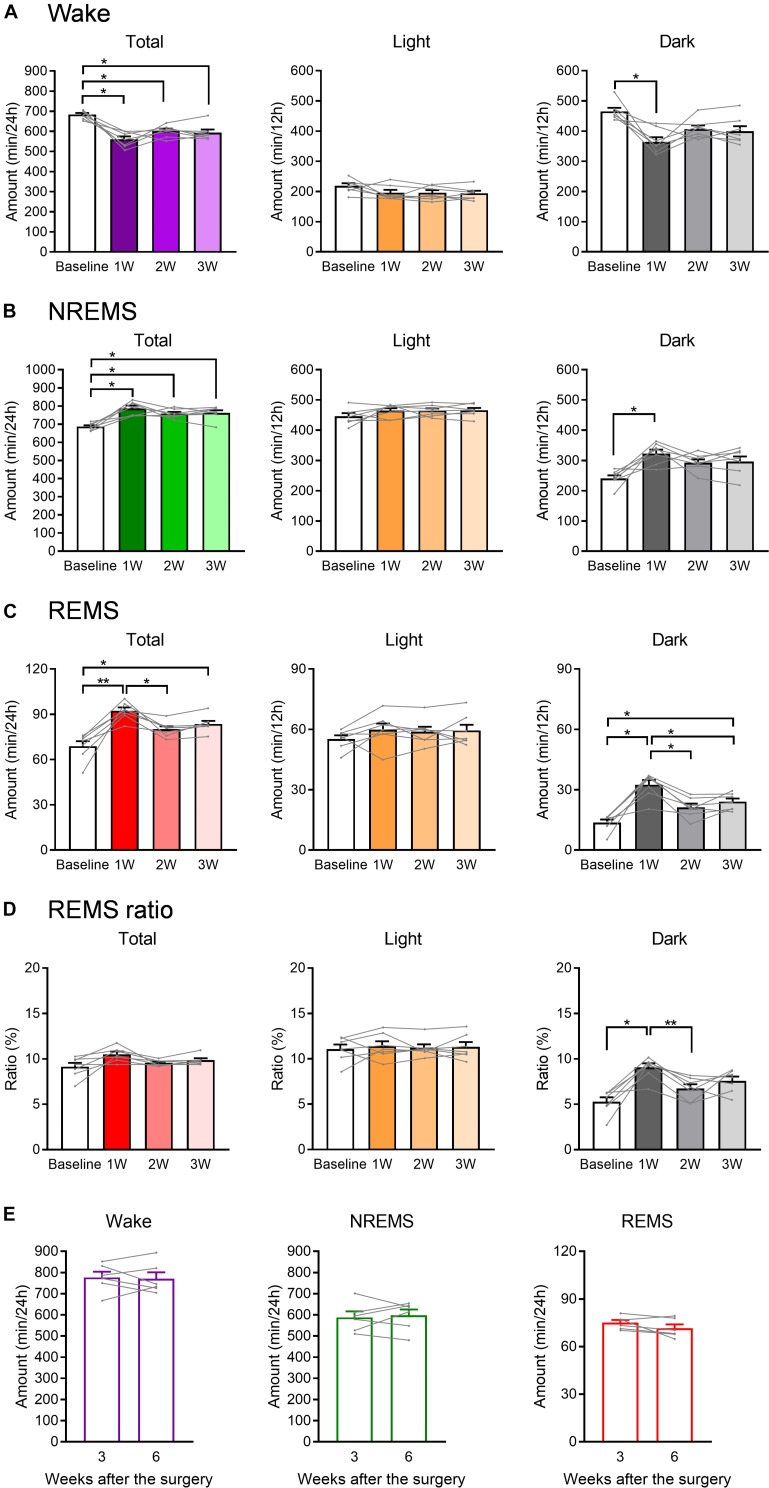
FIGURE 3.
The total amount of each sleep/wake stage was affected by WIRS. (A–C) Total amount of wake (A), NREMS (B), and REMS (C) (24 h, light phase, dark phase). (D) Ratio of REMS amount to the total sleep amount (24 h, light phase, dark phase). (E) Total amount of each sleep/wake stage in naïve mice 3 and 6 weeks after surgery. (A–D) N = 7, (E) N = 6. (A–D) ∗p < 0.05, ∗∗p < 0.01, one-way repeated measures ANOVA followed by Bonferroni’s multiple comparisons test. (E) Paired t-test. (A–D) Data are a summary of the first 24 h of the 45 h recording periods and are presented as means ± SEM.

