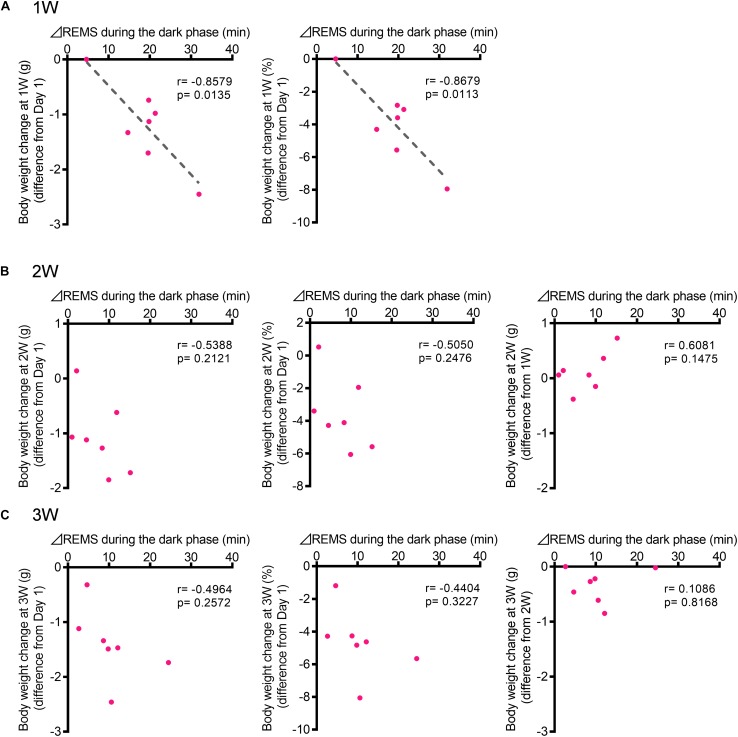
FIGURE 6.
The increase in the REMS amount during the dark phase correlated with the body weight change at 1W. (A) Correlation between change in REMS amount compared with that at baseline during the dark phase at 1W (A), 2W (B), and 3W (C) [Left: actual body weight change (difference from Day 1), Middle: normalized as a percentage (difference from Day 1), and Right: actual body weight change (difference from previous week)]. Change in REMS amount was calculated as follows: (the amount of REMS during the 12 h of dark phase after WIRS at each week) – (the amount of REMS during the 12 h of dark phase in the baseline recording). N = 7. (A–C) Pearson correlation coefficients.

