FIGURE 7.
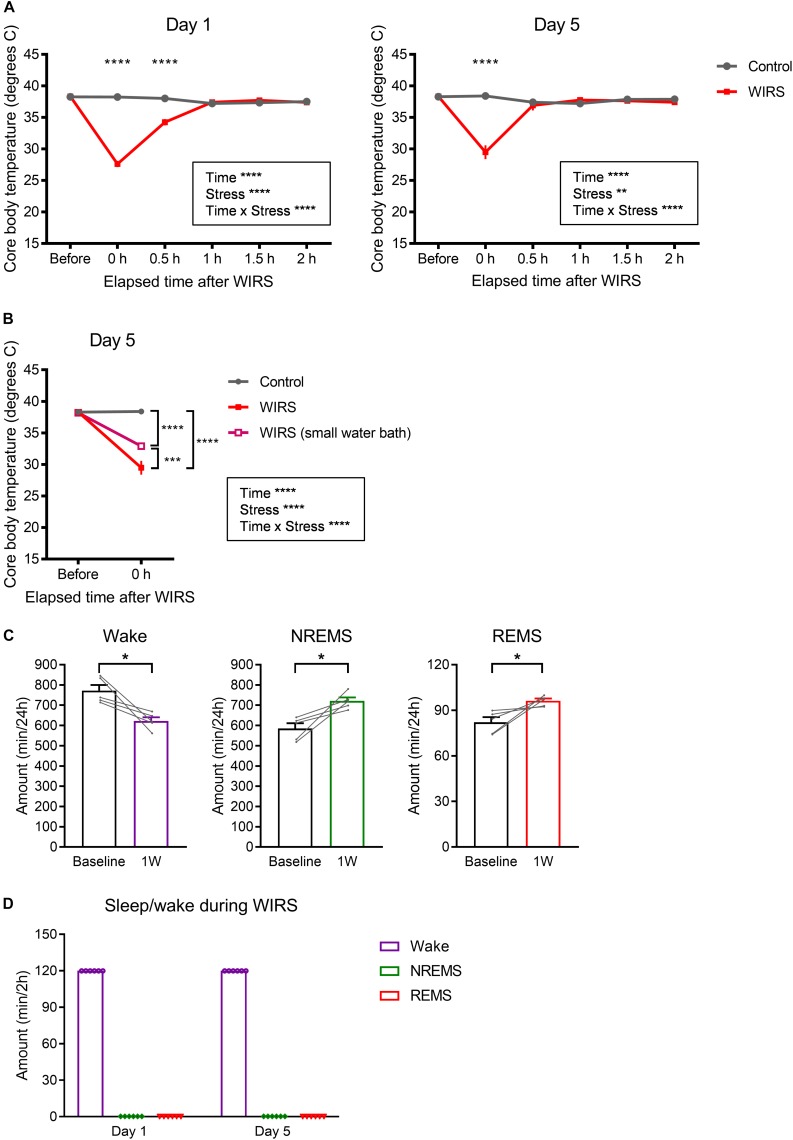
Effects of WIRS on core body temperature and assessment of sleep/wake during the WIRS. (A) Changes in core body temperature before and after the WIRS session on Day 1 and Day 5 during 5 consecutive days of WIRS. (B) Comparison of core body temperature before and after the WIRS session on Day 5 between usage of two types of water baths (one was the original water bath and the other was a smaller water bath). (C) Total amount of each sleep/wake stage in the 24 h following 6 consecutive days of WIRS with the smaller water bath. (D) Total amount of each sleep/wake stage during the WIRS session. (A,B) Control: N = 4, WIRS: N = 4, WIRS using smaller water bath: N = 6. (C) N = 5. (D) N = 6. (A,B) ∗∗p < 0.01, ∗∗∗p < 0.001, ∗∗∗∗p < 0.0001, two-way repeated measures ANOVA followed by Bonferroni’s multiple comparisons test. (C) ∗p < 0.05, paired t-test.

