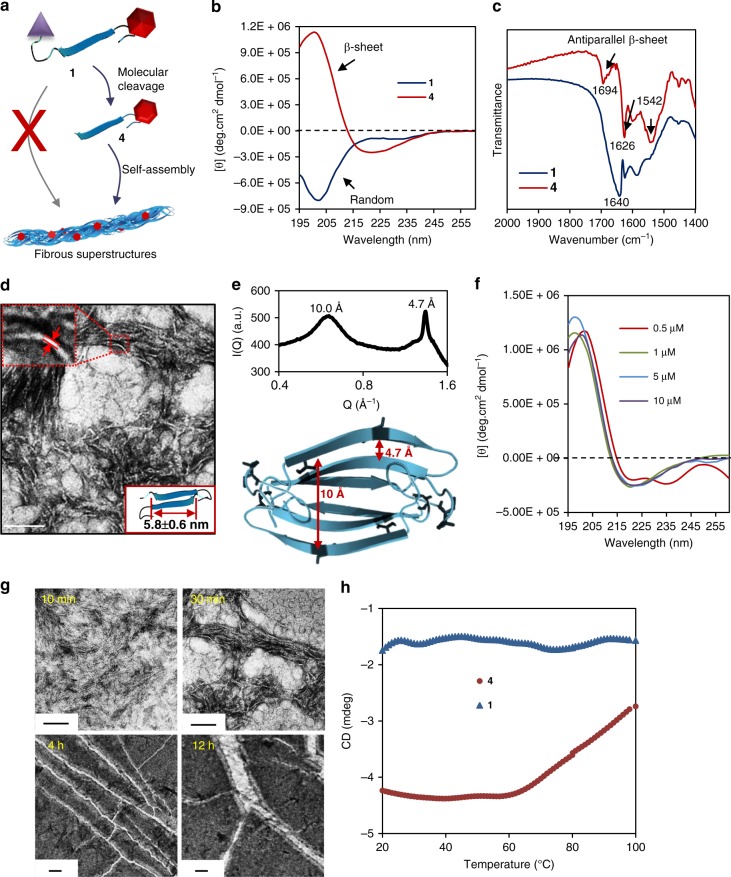
Fig. 2.
The structure conformations and self-assembly properties of molecule 1 in aqueous solution. a Illustration of the self-assembly strategy of molecule 1. b CD spectra of molecule 1 and molecule 4 in deionized water at a concentration of 1 μM. c FTIR spectra of molecule 1 in a monomeric state and molecule 4 in a fibrous assembled state. The arrows identify the typical characteristic peaks of the antiparallel β-sheet structure. d TEM image of self-assembled β-sheet nanofibrils of molecule 1 after treatment with caspase-3 (substrate-to-enzyme ratio of 1 μM/U) in HEPES buffer (50 mM, pH 7.4) for 2 h. The manual measurement of the nanofibril diameter is shown in the zoomed image, and the computational simulation result for the length of molecule 4 is inserted. e WAXS and computational simulation results of the β-sheet self-assemblies (molecule 4) identified the β-sheet and laminate spacing of the structures. f The concentration-dependent CD spectra of molecule 4 in the concentration range of 0.5–10 μM. g Time-dependent TEM images of molecule 4 from 10 min to 12 h for monitoring the growth process of the nanofibrous structures. h Temperature-dependent CD intensity changes at 220 nm of molecules 1 and 4 with a heating rate of 1 °C/min and an equilibrium period of 30 s to reveal the self-assembly mechanisms. Scale bar: 100 nm

