Fig. 4.
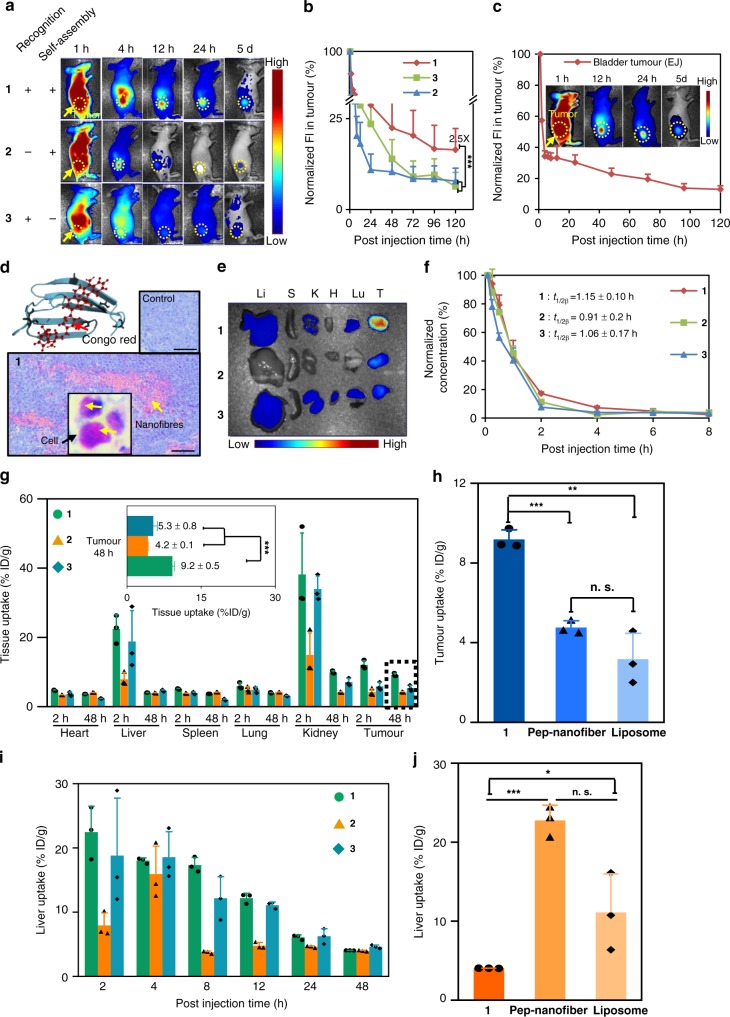
The TCASS induced accumulation and organ competition. a Representative NIR fluorescence images of molecules 1, 2 and 3 on H460 tumour-bearing mice after IV injection. Images were acquired at 1, 4, 12, 24 h and 5 days post injection (p.i.). b Normalized fluorescence intensity in tumour in a. c Representative NIR fluorescence images and normalized fluorescence intensity in tumour on EJ tumour-bearing mice after IV injection. d Light microscopy images of Congo red-stained sections of the tumours. The yellow arrow indicated the nanofibers. From the magnified image, it could be observed that the stained area was in the cell. e Ex vivo NIR fluorescence images of tumour and major organs collected post 48 h injection. Li liver, S spleen, K kidney, H heart, Lu lung, T tumour. f Blood circulation data on molecules 1, 2 and 3. Blood was collected from the mouse tail at different points of time p.i. The molecule levels (in units of ID%/g) in the blood were measured by fluorescence spectroscopy. g The molecular uptakes of molecules 1, 2 and 3 by tumour and major organs in H460 tumour-bearing nude mice at 2 and 48 h p.i. The molecular content of molecules 1, 2 and 3 was determined by the fluorescence of diluted tissue lysates. h Statistical analysis of the tumour accumulation of molecule 1, Pep-nanofiber and Liposome at 48 h p.i. i Liver uptake of molecules 1, 2 and 3 in H460 tumour-bearing mice at 2, 4, 8, 12, 24 and 48 h after injection. j Statistical analysis of the liver retention of molecule 1, Pep-nanofiber and Liposome at 48 h p.i. All data are presented as the mean ± s.d. (n = 3). The molecular concentration used in the experiment was 14 mg/kg.%ID/g = percentage of the injected dose per gram of tissue. In b, g, h and j, n.s. not significant, ***p < 0.001, **p < 0.01, *p < 0.05, p values were performed with one-way ANOVA followed by post hoc Tukey’s test for the indicated comparison. Scale bar: 100 μm

